2026 North Carolina High School Football Report

Week 15 — November 26, 2026

Work in progress. This report is in active development. Ratings and projections will change as the system is refined, and some sections are not yet complete.
Ratings basis: 5986 2026 results, seeded with 2025 Home field: +1.6 pts Generated November 22, 2026

Programs That Ended Their Season

Under NCHSAA rules, a school that stops mid-season forfeits each conference game it has left, and those count as wins for the opponents. Its other remaining games are no contest and count for no one.

Week 15 Projections

28 games. Sorted with the closest matchups first.

Friday, November 27 — 28 games

MatchupProjected resultConfidence
Northern Nash at JacksonvilleJacksonville 23–2253%
Cardinal Gibbons at ClaytonCardinal Gibbons 23–2253%
Warren County at HolmesHolmes 23–2254%
Middle Creek at ScotlandMiddle Creek 24–2156%
Eastern Randolph at WhitevilleEastern Randolph 24–2157%
South Point at CrestCrest 25–2160%
Rolesville at HoggardRolesville 25–2160%
James Kenan at NortheasternNortheastern 25–2160%
Burns at HibritenHibriten 25–2162%
Lake Norman at GrimsleyGrimsley 26–2065%
Reidsville at East DuplinReidsville 26–2066%
Murphy at StarmountStarmount 27–2069%
Kings Mountain at AshevilleKings Mountain 27–2069%
Croatan at Southeast AlamanceSoutheast Alamance 27–2070%
East Lincoln at Jay M RobinsonJay M Robinson 28–2072%
Fike at NorthsideNorthside 28–1973%
Southern School of Energy and Sustainability at ClevelandCleveland 29–1976%
Stuart W Cramer at West StokesStuart W Cramer 29–1976%
Lincolnton at WalkertownLincolnton 29–1977%
Community School of Davidson at Corvian CommunityCorvian Community 30–1979%
Reagan at WeddingtonWeddington 31–1880%
SouthWest Edgecombe at T Wingate AndrewsT Wingate Andrews 32–1883%
Northern Guilford at RobersonRoberson 35–1788%
Chambers at HoughHough 36–1690%
Hendersonville at ShelbyShelby 37–1691%
Robbinsville at Chatham CentralRobbinsville 38–1693%
Hobgood Charter at NorthsideNorthside 46–1297%
Lakewood at TarboroTarboro 46–1297%

Top 25 Power Rankings

SchoolClassRecordPowerSOSMaxPrepsMasseySimmons
1Hough8A12-0-0134.128.2142.5133.2130.5
2Weddington7A12-0-0127.524.5125.3124.6123.0
3Grimsley7A12-0-0126.720.6129.2121.3124.0
4Providence DayNCISAA I12-1-0124.829.1130.7126.7123.4
5Millbrook8A9-1-1123.224.6115.7114.9121.3
6Lake Norman7A12-0-0123.019.5117.3114.3116.0
7Rolesville8A9-2-1120.827.0109.7110.8118.6
8Chambers8A11-1-0117.826.6115.8111.5117.1
9Reagan7A10-2-0117.626.1117.3112.6112.2
10Cleveland7A11-1-0117.124.2111.9115.9114.4
11Mallard Creek8A9-3-0117.034.1123.8117.8121.1
12Cardinal Gibbons7A9-3-0116.427.9119.5114.5113.1
13Hoggard8A11-1-0116.219.0106.9110.0114.4
14Junius H Rose6A11-1-0115.923.1111.1102.1115.1
15West Forsyth8A9-3-0115.629.0118.3114.7112.7
16Northern Nash6A10-2-0114.516.8104.3100.2108.0
17Clayton7A10-2-0114.120.9108.7113.8109.7
18Jacksonville6A9-2-0114.118.1109.6104.7110.1
19Garner7A9-3-0113.228.1115.7107.4113.9
20East Forsyth7A8-4-0111.227.7112.1110.3108.2
21Jay M Robinson5A12-0-0111.25.9107.6106.0103.7
22Middle Creek6A10-2-0111.123.1107.6102.4109.7
23Crest5A11-1-0110.822.1112.9110.4111.8
24Southeast Raleigh7A8-4-0110.823.4107.8110.3107.6
25Oak Grove5A9-3-0109.814.3104.0106.1103.1

Rank all teams statewide →  or by classification: 8A · 7A · 6A · 5A · 4A · 3A · 2A · 1A

By Classification

8A — top 10
SchoolRecordPowerSOS
1Hough12-0-0134.128.2
2Millbrook9-1-1123.224.6
3Rolesville9-2-1120.827.0
4Chambers11-1-0117.826.6
5Mallard Creek9-3-0117.034.1
6Hoggard11-1-0116.219.0
7West Forsyth9-3-0115.629.0
8Palisades9-3-0105.119.8
9Myers Park8-4-0105.026.5
10West Charlotte7-5-0100.533.0

Rank all 8A teams →

7A — top 10
SchoolRecordPowerSOS
1Weddington12-0-0127.524.5
2Grimsley12-0-0126.720.6
3Lake Norman12-0-0123.019.5
4Reagan10-2-0117.626.1
5Cleveland11-1-0117.124.2
6Cardinal Gibbons9-3-0116.427.9
7Clayton10-2-0114.120.9
8Garner9-3-0113.228.1
9East Forsyth8-4-0111.227.7
10Southeast Raleigh8-4-0110.823.4

Rank all 7A teams →

6A — top 10
SchoolRecordPowerSOS
1Junius H Rose11-1-0115.923.1
2Northern Nash10-2-0114.516.8
3Jacksonville9-2-0114.118.1
4Middle Creek10-2-0111.123.1
5Scotland11-1-0107.913.8
6Roberson10-2-0107.812.1
7Kings Mountain9-3-0107.516.2
8Seventy-First10-2-0103.99.7
9Asheville11-1-0100.014.8
10Union Pines10-2-098.47.1

Rank all 6A teams →

5A — top 10
SchoolRecordPowerSOS
1Jay M Robinson12-0-0111.25.9
2Crest11-1-0110.822.1
3Oak Grove9-3-0109.814.3
4South Point11-1-0108.819.1
5Northside12-0-0107.412.9
6Hickory8-4-0107.015.8
7Monroe9-3-0107.016.3
8East Lincoln11-1-0105.113.2
9Fike10-2-0100.76.1
10Southeast Alamance12-0-099.38.3

Rank all 5A teams →

4A — top 10
SchoolRecordPowerSOS
1Stuart W Cramer10-2-098.3-2.6
2Hibriten12-0-097.7-7.4
3Reidsville9-3-095.52.2
4West Iredell10-2-095.36.9
5Burns9-3-095.07.2
6West Craven9-3-094.23.5
7T Wingate Andrews11-1-092.7-0.1
8Tuscola10-2-092.23.2
9East Duplin11-1-089.01.4
10West Stokes8-2-087.72.8

Rank all 4A teams →

3A — top 10
SchoolRecordPowerSOS
1Shelby11-1-0102.34.6
2Lincolnton9-3-095.52.8
3North Stanly10-1-093.2-6.6
4Northeastern11-1-091.64.4
5James Kenan10-1-089.5-1.6
6Eastern Randolph9-3-086.80.0
7Hendersonville12-0-085.3-7.3
8Wallace-Rose Hill7-5-085.0-1.8
9Walkertown11-1-084.7-8.9
10Whiteville11-0-083.4-8.2

Rank all 3A teams →

2A — top 10
SchoolRecordPowerSOS
1Tarboro11-1-097.0-2.2
2Corvian Community11-1-092.3-0.2
3Warren County12-0-088.9-22.2
4Holmes10-1-088.8-10.4
5Starmount11-1-087.7-6.7
6Community School of Davidson9-3-083.2-3.8
7Murphy10-2-082.8-6.2
8East Wilkes7-5-082.0-1.4
9Alleghany7-4-073.3-5.2
10North Rowan7-4-073.1-6.9

Rank all 2A teams →

1A — top 10
SchoolRecordPowerSOS
1Northside12-0-076.9-26.1
2Robbinsville7-5-076.8-7.4
3Wilson Preparatory Academy7-5-071.7-5.2
4Chatham Central11-0-055.3-31.0
5Rosman6-6-053.4-15.4
6Winston-Salem Preparatory Acad6-5-051.0-23.0
7East Columbus Junior-Senior5-7-045.9-14.6
8South Davidson Middle and6-5-044.9-32.0
9Sallie B Howard7-4-044.1-27.7
10North Edgecombe7-5-043.7-23.3

Rank all 1A teams →

NCCSA — top 4
SchoolRecordPowerSOS
1Liberty Christian Academy6-1-049.6-34.6
2Community Christian6-4-042.6-33.4
3Sandhills Classical Christian2-4-036.7-29.8
4Father Capodanno2-5-028.5-27.6

Rank all NCCSA teams →

NCISAA — top 10
SchoolRecordPowerSOS
1Providence Day12-1-0124.829.1
2Asheville School (Independent)9-3-098.811.3
3Cannon [Cannon/Concord Academy]8-4-098.421.4
4Christ School7-4-094.217.5
5High Point Christian Academy9-3-091.30.9
6Charlotte Country Day School3-8-087.124.4
7Charlotte Latin5-6-085.823.5
8Trinity Christian8-5-082.74.3
9Charlotte Christian3-7-082.518.7
10John Paul II Catholic10-2-080.4-14.7

Rank all NCISAA teams →

independent — top 6
SchoolRecordPowerSOS
1Wayne Christian6-4-059.4-18.3
2Lawrence Academy5-4-051.5-24.4
3Mount Zion Christian Academy3-5-047.5-29.5
4South Wake Christian Athletics2-7-043.7-14.4
5GRACE Christian4-6-040.8-20.4
6North Wake Saints4-5-039.4-26.4

Rank all independent teams →

Leaders

Scoring tables are as played. Adjusted tables account for the opponent, so ten points conceded to a strong offense outranks a shutout of a weak one — the two disagree on purpose.

Scoring offenses

SchoolClassPPG
1Pungo Christian AcademyNCISAA 851.0
2North Stanly3A48.7
3Warren County2A48.0
4Princeton3A47.6
5Southeast Alamance5A47.2
6Holmes2A47.1
7Tarboro2A45.8
8Lake Norman7A45.8
9Seaforth5A45.6
10Lincolnton3A45.6

Rank all →

Offenses, adjusted

SchoolClassAdj
1Lake Norman7A+23.0
2Hough8A+22.4
3Jacksonville6A+21.7
4Southeast Alamance5A+21.5
5Weddington7A+21.3
6Grimsley7A+20.7
7Providence DayNCISAA I+20.6
8Middle Creek6A+19.9
9Asheville School (Independent)NCISAA II+19.7
10Cleveland7A+19.4

Rank all →

Scoring defenses

SchoolClassPA/G
1Warren County2A3.3
2Jay M Robinson5A3.9
3Grimsley7A4.2
4Millbrook8A4.5
5Hough8A5.7
6Southern School of Energy and Sustainability7A6.5
7Northside1A6.8
8Hibriten4A6.9
9Weddington7A7.5
10Oak Grove5A8.3

Rank all →

Defenses, adjusted

SchoolClassAdj
1Hough8A-27.3
2Millbrook8A-26.6
3Grimsley7A-24.4
4Providence DayNCISAA I-22.8
5Weddington7A-22.7
6Junius H Rose6A-21.5
7Northern Nash6A-21.2
8Crest5A-20.9
9Reagan7A-20.7
10Jay M Robinson5A-20.4

Rank all →

Toughest schedules

SchoolClassSOS
1Mallard Creek8A34.1
2West Charlotte8A33.0
3Butler7A29.8
4Independence7A29.6
5Providence DayNCISAA I29.1
6West Forsyth8A29.0
7Hough8A28.2
8Garner7A28.1
9Cardinal Gibbons7A27.9
10East Forsyth7A27.7

Rank all →

Each full list opens statewide, sorted the same way, and can be narrowed to one classification or association from its page.

Classification Strength

Fitted from games between classifications, not assumed.

ClassLevel
8A+22.5
NCISAA I+18.1
7A+16.4
6A+9.9
5A+6.1
NCISAA II-0.4
4A-2.8
3A-8.9
2A-14.3
NCISAA 8-24.3
8-MAN-27.6
1A-29.3

Conference Power Rankings

Every team, strongest first.

Every conference ranked against the others: All · 8A · 7A · 6A · 5A · 4A · 3A · 2A · 1A

8 Man Freelance — 1 teams
SchoolClassRecordPowerSOS
1Lawrence AcademyNCISAA 85-4-051.5-24.4

8 Man Freelance page, with conference records →

Albemarle AAC — 6 teams
SchoolClassRecordPowerSOS
1Holmes2A10-1-088.8-10.4
2Gates County2A6-6-061.9-8.9
3Manteo2A8-4-057.5-13.6
4Camden County2A5-7-052.2-13.9
5Bertie2A3-8-046.9-4.0
6Perquimans County2A3-8-045.6-13.6

Albemarle AAC page, with conference records →

Atlantic — 3 teams
SchoolClassRecordPowerSOS
1Hobgood Charter1A9-2-042.3-39.6
2Bear Grass Charter1A1-8-022.6-33.5
3Columbia1A2-6-021.3-34.0

Atlantic page, with conference records →

Big Carolina — 6 teams
SchoolClassRecordPowerSOS
1Junius H Rose6A11-1-0115.923.1
2Jacksonville6A9-2-0114.118.1
3New Bern7A8-4-099.323.5
4D H Conley7A8-5-087.220.1
5South Central7A4-7-086.219.2
6White Oak6A2-8-065.315.7

Big Carolina page, with conference records →

Big East — 7 teams
SchoolClassRecordPowerSOS
1Northern Nash6A10-2-0114.516.8
2Fike5A10-2-0100.76.1
3Hunt5A10-2-091.913.7
4Rocky Mount5A7-5-084.19.2
5Southern Nash5A5-7-076.914.7
6Charles B Aycock5A2-9-063.77.1
7Southern Wayne5A4-7-057.94.1

Big East page, with conference records →

Big Seven — 6 teams
SchoolClassRecordPowerSOS
1Seaforth5A10-2-082.3-9.2
2Orange5A7-5-068.3-5.7
3South Granville5A7-5-067.9-6.9
4J. F. Webb5A4-7-057.3-10.9
5Carrboro4A1-9-030.3-17.6
6Cedar Ridge5A1-7-019.1-18.1

Big Seven page, with conference records →

Big South — 7 teams
SchoolClassRecordPowerSOS
1Crest5A11-1-0110.822.1
2South Point5A11-1-0108.819.1
3Kings Mountain6A9-3-0107.516.2
4Ashbrook6A7-6-093.817.9
5Huss5A3-8-077.014.0
6Forestview5A2-9-066.115.1
7North Gaston5A0-10-036.513.1

Big South page, with conference records →

CAP — 8 teams
SchoolClassRecordPowerSOS
1Millbrook8A9-1-1123.224.6
2Rolesville8A9-2-1120.827.0
3Leesville Road8A7-5-098.921.3
4Broughton8A5-5-082.921.1
5Corinth Holders8A2-7-080.219.7
6Enloe8A3-6-079.618.9
7Wakefield8A4-7-076.423.0
8Athens Drive8A2-8-068.418.1

CAP page, with conference records →

Carolina — 7 teams
SchoolClassRecordPowerSOS
1Lakewood2A9-3-062.7-14.9
2East Bladen2A8-4-061.1-13.6
3Hobbton2A4-8-059.1-9.4
4North Duplin Jr Sr2A5-5-053.6-21.0
5West Columbus2A5-6-052.6-12.1
6East Columbus Junior-Senior1A5-7-045.9-14.6
7Union2A3-8-039.4-22.6

Carolina page, with conference records →

Carolina Coast — 7 teams
SchoolClassRecordPowerSOS
1Hoggard8A11-1-0116.219.0
2Laney8A6-6-092.325.3
3Ashley7A7-5-085.718.1
4Topsail7A5-7-085.122.1
5North Brunswick7A6-6-079.114.4
6New Hanover7A2-9-075.121.2
7West Brunswick6A2-8-072.112.1

Carolina Coast page, with conference records →

Carolina Pines — 8 teams
SchoolClassRecordPowerSOS
1Union Pines6A10-2-098.47.1
2Harnett Central6A9-3-088.2-1.2
3Triton6A10-2-082.92.8
4South Johnston6A5-7-072.06.1
5West Johnston6A4-7-066.46.4
6Lee County6A2-9-065.09.5
7Western Harnett6A4-7-052.4-5.0
8Southern Lee6A0-10-041.08.7

Carolina Pines page, with conference records →

Catawba Shores — 8 teams
SchoolClassRecordPowerSOS
1Corvian Community2A11-1-092.3-0.2
2Community School of Davidson2A9-3-083.2-3.8
3Christ the King2A7-4-072.3-8.1
4Lake Norman Charter4A8-4-070.6-2.9
5Pine Lake Preparatory3A4-7-049.0-10.7
6Langtree Charter Academy2A4-8-047.5-10.7
7Bradford Preparatory2A2-9-041.8-12.3
8Lincoln Charter4A2-9-041.7-5.1

Catawba Shores page, with conference records →

Central Carolina — 6 teams
SchoolClassRecordPowerSOS
1Thomasville3A10-2-083.0-10.3
2West Davidson3A7-4-070.5-11.0
3Providence Grove3A7-5-067.1-9.4
4Wheatmore3A3-8-054.7-13.5
5East Davidson3A3-8-041.7-10.1
6Trinity3A1-10-025.0-10.5

Central Carolina page, with conference records →

Central Piedmont — 6 teams
SchoolClassRecordPowerSOS
1Reagan7A10-2-0117.626.1
2West Forsyth8A9-3-0115.629.0
3East Forsyth7A8-4-0111.227.7
4R J Reynolds7A4-7-076.811.3
5Northwest Guilford8A2-8-074.026.3
6Parkland7A3-8-066.89.8

Central Piedmont page, with conference records →

Christian Independent — 4 teams
SchoolClassRecordPowerSOS
1Liberty Christian AcademyNCISAA 86-1-049.6-34.6
2Community Christian8-MAN6-4-042.6-33.4
3Sandhills Classical ChristianNCISAA 82-4-036.7-29.8
4Father Capodanno8-MAN2-5-028.5-27.6

Christian Independent page, with conference records →

Coastal — 7 teams
SchoolClassRecordPowerSOS
1Northside5A12-0-0107.412.9
2Havelock5A6-6-094.318.3
3Croatan5A11-1-093.85.0
4Swansboro6A8-4-076.32.3
5West Carteret5A5-7-066.510.4
6Dixon5A2-8-065.34.0
7Richlands5A2-9-060.88.0

Coastal page, with conference records →

Coastal Plains — 6 teams
SchoolClassRecordPowerSOS
1Northside1A12-0-076.9-26.1
2Southside2A7-4-045.9-24.0
3East Carteret2A5-7-045.5-18.0
4Lejeune2A2-8-030.0-29.8
5Pamlico County2A3-8-029.4-22.9
6Jones1A0-11-06.2-32.5

Coastal Plains page, with conference records →

Diamond Nine — 1 teams
SchoolClassRecordPowerSOS
1Triangle Math and Science Academy2A1-6-09.7-32.8

Diamond Nine page, with conference records →

East Central — 6 teams
SchoolClassRecordPowerSOS
1East Duplin4A11-1-089.01.4
2Clinton4A8-4-076.1-1.5
3Southwest4A5-7-068.1-2.5
4Pender3A4-7-067.8-8.8
5Heide Trask3A2-9-037.2-8.8
6South Lenoir3A3-8-037.2-13.0

East Central page, with conference records →

Eastern Carolina — 6 teams
SchoolClassRecordPowerSOS
1Wilson Preparatory Academy1A7-5-071.7-5.2
2Sallie B Howard1A7-4-044.1-27.7
3North Edgecombe1A7-5-043.7-23.3
4Washington County1A3-9-039.6-26.5
5North East Carolina Prep1A5-5-036.2-34.5
6Rocky Mount Preparatory1A4-7-035.9-32.6

Eastern Carolina page, with conference records →

Eastern Plains — 6 teams
SchoolClassRecordPowerSOS
1Tarboro2A11-1-097.0-2.2
2Greene Central3A7-5-078.5-6.9
3Kinston3A5-6-072.4-5.5
4Farmville Central3A7-5-070.21.4
5Ayden-Grifton3A2-9-056.61.2
6Beddingfield3A0-10-028.5-3.9

Eastern Plains page, with conference records →

Eastern Sandhills — 6 teams
SchoolClassRecordPowerSOS
1Seventy-First6A10-2-0103.99.7
2Westover6A7-5-087.310.5
3Saint Pauls5A8-4-084.11.5
4South View6A3-8-078.211.9
5E E Smith6A2-8-073.48.0
6Douglas Byrd5A0-10-037.04.8

Eastern Sandhills page, with conference records →

Four Rivers — 5 teams
SchoolClassRecordPowerSOS
1Eastern Randolph3A9-3-086.80.0
2Southwestern Randolph4A8-4-070.2-14.6
3Northwood3A6-6-064.5-2.7
4Jordan-Matthews4A4-7-036.7-16.7
5North Moore3A0-9-033.31.1

Four Rivers page, with conference records →

Freelance — 2 teams
SchoolClassRecordPowerSOS
1Wayne ChristianNCISAA II6-4-059.4-18.3
2Mount Zion Christian Academy—3-5-047.5-29.5

Freelance page, with conference records →

Greater Charlotte — 6 teams
SchoolClassRecordPowerSOS
1Hough8A12-0-0134.128.2
2Myers Park8A8-4-0105.026.5
3Hopewell7A5-6-080.714.7
4South Mecklenburg8A4-7-079.217.9
5West Mecklenburg7A2-8-070.712.9
6Garinger8A2-8-050.88.5

Greater Charlotte page, with conference records →

Greater Metro GMAC — 8 teams
SchoolClassRecordPowerSOS
1Hickory Ridge7A9-3-0106.27.8
2A L Brown7A11-1-0102.411.4
3West Cabarrus7A6-6-082.216.6
4Olympic6A4-7-075.912.8
5Central Cabarrus6A3-8-073.611.3
6Phillip O Berry Academy of Technology6A5-6-066.69.1
7Harding University6A2-8-065.511.1
8Cox Mill7A2-8-064.39.3

Greater Metro GMAC page, with conference records →

Greater Neuse River — 7 teams
SchoolClassRecordPowerSOS
1Cleveland7A11-1-0117.124.2
2Clayton7A10-2-0114.120.9
3Garner7A9-3-0113.228.1
4Southeast Raleigh7A8-4-0110.823.4
5Fuquay-Varina7A4-7-086.623.5
6South Garner7A4-8-083.918.8
7Smithfield-Selma7A0-10-055.721.0

Greater Neuse River page, with conference records →

Greater Triad — 7 teams
SchoolClassRecordPowerSOS
1Chatham Central1A11-0-055.3-31.0
2Winston-Salem Preparatory Acad1A6-5-051.0-23.0
3South Davidson Middle and1A6-5-044.9-32.0
4Bishop McGuinness2A3-8-042.3-25.4
5South Stokes2A5-6-040.3-24.8
6College Prep and Leadership Academy1A3-8-032.0-25.6
7North Stokes1A1-11-024.4-21.3

Greater Triad page, with conference records →

Meck Power Six — 6 teams
SchoolClassRecordPowerSOS
1Chambers8A11-1-0117.826.6
2Mallard Creek8A9-3-0117.034.1
3West Charlotte8A7-5-0100.533.0
4Butler7A5-7-092.929.8
5Independence7A2-9-085.829.6
6North Mecklenburg7A3-7-085.116.7

Meck Power Six page, with conference records →

Metro — 7 teams
SchoolClassRecordPowerSOS
1Grimsley7A12-0-0126.720.6
2Page7A9-2-0106.68.2
3Dudley6A7-5-094.919.3
4Ragsdale6A6-6-086.111.4
5Southwest Guilford7A2-8-060.311.4
6Western Guilford6A3-7-056.27.6
7Ben L. Smith6A1-9-052.59.9

Metro page, with conference records →

Mid Carolina — 7 teams
SchoolClassRecordPowerSOS
1Southeast Alamance5A12-0-099.38.3
2Southern Alamance6A9-3-095.214.5
3Eastern Alamance5A7-3-095.010.7
4Williams6A7-3-091.116.1
5Western Alamance5A6-6-079.18.9
6Person5A2-9-066.911.5
7Cummings4A1-10-057.09.5

Mid Carolina page, with conference records →

Mid South — 6 teams
SchoolClassRecordPowerSOS
1Pinecrest8A8-4-0100.024.5
2Richmond7A5-7-099.127.0
3Hoke County8A5-6-089.223.2
4Jack Britt7A6-6-087.821.9
5Overhills7A4-7-079.513.2
6Pine Forest7A3-8-072.817.7

Mid South page, with conference records →

Mid State — 7 teams
SchoolClassRecordPowerSOS
1Reidsville4A9-3-095.52.2
2Walkertown3A11-1-084.7-8.9
3Rockingham County5A4-7-069.3-2.2
4Morehead4A7-4-063.8-7.9
5Carver4A3-8-038.9-12.0
6Bartlett Yancey3A1-9-032.5-11.6
7McMichael3A2-9-025.4-10.0

Mid State page, with conference records →

Mountain — 6 teams
SchoolClassRecordPowerSOS
1Roberson6A10-2-0107.812.1
2Asheville6A11-1-0100.014.8
3Enka5A9-3-082.02.4
4Reynolds6A4-8-076.815.5
5Erwin5A4-7-076.110.0
6North Buncombe5A4-7-064.31.6

Mountain page, with conference records →

Mountain Eight — 8 teams
SchoolClassRecordPowerSOS
1Franklin5A10-1-098.16.1
2Tuscola4A10-2-092.23.2
3Smoky Mountain5A9-3-090.1-0.7
4Pisgah4A6-5-075.52.3
5West Henderson5A6-6-074.45.8
6North Henderson5A2-9-065.67.7
7Brevard4A1-9-052.66.1
8East Henderson4A1-9-048.02.4

Mountain Eight page, with conference records →

Mountain Valley — 8 teams
SchoolClassRecordPowerSOS
1Starmount2A11-1-087.7-6.7
2East Wilkes2A7-5-082.0-1.4
3Wilkes Central4A9-4-079.2-9.3
4Alleghany2A7-4-073.3-5.2
5West Wilkes3A9-4-068.2-7.6
6North Wilkes3A5-7-062.4-8.9
7Ashe County4A1-9-039.6-1.9
8Elkin2A2-9-029.1-9.5

Mountain Valley page, with conference records →

NCISAA 8 Man Freelance — 9 teams
SchoolClassRecordPowerSOS
1John Paul II CatholicNCISAA 810-2-080.4-14.7
2Cary ChristianNCISAA 88-2-076.3-11.5
3Faith ChristianNCISAA 87-2-069.8-12.9
4Pungo Christian AcademyNCISAA 88-0-060.5-46.1
5St. David'sNCISAA 86-4-051.4-14.4
6Wake Christian AcademyNCISAA 82-9-042.5-13.4
7Arendell Parrott AcademyNCISAA 82-6-040.0-6.2
8Halifax AcademyNCISAA 82-4-129.8-37.8
9Northeast AcademyNCISAA 80-5-0-1.5-38.7

NCISAA 8 Man Freelance page, with conference records →

NCISAA Big 6 — 5 teams
SchoolClassRecordPowerSOS
1Asheville School (Independent)NCISAA II9-3-098.811.3
2High Point Christian AcademyNCISAA II9-3-091.30.9
3SouthLake Christian AcademyNCISAA II6-6-066.6-1.6
4Hickory Grove ChristianNCISAA II7-4-057.6-15.1
5Covenant DayNCISAA II1-8-056.53.0

NCISAA Big 6 page, with conference records →

NCISAA Big East — 4 teams
SchoolClassRecordPowerSOS
1Trinity ChristianNCISAA II8-5-082.74.3
2North Raleigh Christian AcademyNCISAA I7-3-074.4-2.6
3Harrells Christian AcademyNCISAA II4-6-072.37.2
4RavenscroftNCISAA I2-8-058.1-0.3

NCISAA Big East page, with conference records →

NCISAA Big South — 4 teams
SchoolClassRecordPowerSOS
1Providence DayNCISAA I12-1-0124.829.1
2Charlotte Country Day SchoolNCISAA I3-8-087.124.4
3Charlotte LatinNCISAA I5-6-085.823.5
4Charlotte ChristianNCISAA I3-7-082.518.7

NCISAA Big South page, with conference records →

NCISAA Western — 3 teams
SchoolClassRecordPowerSOS
1Cannon [Cannon/Concord Academy]NCISAA I8-4-098.421.4
2Christ SchoolNCISAA I7-4-094.217.5
3Metrolina Christian AcademyNCISAA I4-7-076.011.6

NCISAA Western page, with conference records →

North Carolina Independent — 3 teams
SchoolClassRecordPowerSOS
1South Wake Christian Athletics—2-7-043.7-14.4
2GRACE ChristianNCISAA II4-6-040.8-20.4
3North Wake Saints—4-5-039.4-26.4

North Carolina Independent page, with conference records →

North Piedmont — 6 teams
SchoolClassRecordPowerSOS
1Lake Norman7A12-0-0123.019.5
2Mooresville7A6-6-0102.126.9
3Davie County7A8-5-096.324.2
4Statesville6A4-7-083.414.2
5South Iredell7A2-9-073.722.1
6North Iredell6A0-10-040.215.7

North Piedmont page, with conference records →

Northeastern Coastal — 5 teams
SchoolClassRecordPowerSOS
1Northeastern3A11-1-091.64.4
2Martin County3A8-4-082.80.5
3Hertford County3A6-5-077.63.9
4Pasquotank County3A5-5-070.91.0
5Currituck County5A3-7-064.8-0.4

Northeastern Coastal page, with conference records →

Northern Six — 6 teams
SchoolClassRecordPowerSOS
1Wake Forest7A9-3-0108.416.2
2Franklinton6A8-3-086.2-0.7
3Heritage7A5-6-079.114.8
4East Wake7A3-8-068.18.0
5Knightdale7A1-9-058.69.2
6Vance County6A1-9-057.012.8

Northern Six page, with conference records →

Northwest — 6 teams
SchoolClassRecordPowerSOS
1West Stokes4A8-2-087.72.8
2Mount Airy3A7-4-081.58.1
3East Surry3A5-7-066.9-0.0
4North Surry4A5-6-065.8-5.2
5Forbush4A4-7-052.7-10.0
6Surry Central3A0-8-025.4-18.7

Northwest page, with conference records →

Northwestern — 6 teams
SchoolClassRecordPowerSOS
1Alexander Central6A8-3-085.54.4
2Freedom6A8-3-083.6-0.6
3Watauga6A6-6-080.88.1
4Saint Stephens6A3-8-073.44.5
5South Caldwell6A3-8-054.97.7
6McDowell7A1-9-051.71.6

Northwestern page, with conference records →

PAC Seven — 6 teams
SchoolClassRecordPowerSOS
1T Wingate Andrews4A11-1-092.7-0.1
2Montgomery Central5A6-6-076.46.7
3Randleman4A5-7-071.54.7
4Ledford4A5-7-068.25.4
5Central Davidson4A4-8-065.51.1
6Lexington4A3-9-062.90.2

PAC Seven page, with conference records →

Piedmont Triad — 6 teams
SchoolClassRecordPowerSOS
1Oak Grove5A9-3-0109.814.3
2Mount Tabor6A6-5-096.521.5
3North Davidson5A8-4-089.58.1
4Glenn6A6-5-079.47.6
5Atkins5A2-8-049.17.0
6North Forsyth Magnet5A1-9-048.06.6

Piedmont Triad page, with conference records →

Quad City Seven — 7 teams
SchoolClassRecordPowerSOS
1Apex Friendship8A11-1-098.011.5
2Jordan8A8-4-095.313.7
3Green Hope8A9-3-090.45.9
4Panther Creek8A6-5-084.914.9
5Apex8A3-7-079.69.2
6Willow Spring8A3-8-075.116.2
7Green Level8A1-9-062.712.1

Quad City Seven page, with conference records →

Quad County — 6 teams
SchoolClassRecordPowerSOS
1Nash Central4A4-7-064.61.4
2Bunn4A5-6-064.3-10.6
3Wake Preparatory Academy3A6-5-060.3-13.7
4Louisburg Magnet3A8-4-060.3-15.7
5Roanoke Rapids4A5-6-059.6-11.3
6American Leadership Academy - Johnston2A1-9-030.2-16.2

Quad County page, with conference records →

Roanoke River — 6 teams
SchoolClassRecordPowerSOS
1Warren County2A12-0-088.9-22.2
2Southeast Collegiate Prep Academy1A4-7-042.8-27.8
3Northampton County2A2-10-038.5-16.6
4Northwest Halifax Collegiate and Technical Academy2A6-6-036.3-27.3
5KIPP Pride1A4-8-027.2-23.4
6Weldon STEM1A1-10-016.1-26.5

Roanoke River page, with conference records →

Rocky River — 6 teams
SchoolClassRecordPowerSOS
1Monroe5A9-3-0107.016.3
2Forest Hills5A9-3-084.86.5
3Parkwood5A6-6-081.314.4
4Mount Pleasant4A7-4-079.38.7
5Anson4A5-7-069.90.8
6West Stanly4A5-7-065.67.8

Rocky River page, with conference records →

Smoky Mountain — 7 teams
SchoolClassRecordPowerSOS
1Murphy2A10-2-082.8-6.2
2Robbinsville1A7-5-076.8-7.4
3Cherokee2A7-5-061.2-8.0
4Rosman1A6-6-053.4-15.4
5Swain County2A3-8-053.0-5.2
6Hayesville2A1-9-034.9-9.9
7Andrews1A1-9-033.1-8.6

Smoky Mountain page, with conference records →

South Piedmont — 8 teams
SchoolClassRecordPowerSOS
1Jay M Robinson5A12-0-0111.25.9
2West Rowan5A9-3-089.59.5
3Northwest Cabarrus5A7-4-081.86.1
4South Rowan4A7-5-069.6-3.5
5Carson5A4-7-068.83.9
6East Rowan5A4-7-062.92.7
7Concord5A1-9-056.45.8
8Salisbury4A3-8-056.29.4

South Piedmont page, with conference records →

Southeastern — 6 teams
SchoolClassRecordPowerSOS
1Whiteville3A11-0-083.4-8.2
2Fairmont4A5-6-068.6-3.7
3South Columbus3A6-5-066.4-4.4
4South Brunswick5A5-6-063.1-8.8
5Red Springs4A1-8-032.1-2.5
6West Bladen3A0-5-030.5-18.4

Southeastern page, with conference records →

Southern Carolina — 7 teams
SchoolClassRecordPowerSOS
1Weddington7A12-0-0127.524.5
2Marvin Ridge7A10-2-0105.420.8
3Charlotte Catholic6A8-5-094.219.8
4Sun Valley6A6-6-091.724.3
5Porter Ridge7A4-8-083.825.9
6Piedmont6A3-8-073.114.5
7Cuthbertson7A1-9-065.719.9

Southern Carolina page, with conference records →

Southern Piedmont — 9 teams
SchoolClassRecordPowerSOS
1Shelby3A11-1-0102.34.6
2Stuart W Cramer4A10-2-098.3-2.6
3Lincolnton3A9-3-095.52.8
4Burns4A9-3-095.07.2
5Cherryville2A8-5-070.6-5.0
6West Lincoln3A4-8-064.21.9
7East Gaston4A5-6-057.3-0.1
8Bessemer City3A1-10-037.13.7
9Highland Tech2A0-10-026.61.0

Southern Piedmont page, with conference records →

Southwestern — 6 teams
SchoolClassRecordPowerSOS
1Palisades8A9-3-0105.119.8
2Ardrey Kell8A7-4-093.416.5
3Providence8A5-6-091.020.2
4Ballantyne Ridge7A4-7-076.810.6
5East Mecklenburg8A4-6-072.98.2
6Rocky River7A0-10-049.18.7

Southwestern page, with conference records →

Swine Valley — 6 teams
SchoolClassRecordPowerSOS
1James Kenan3A10-1-089.5-1.6
2Wallace-Rose Hill3A7-5-085.0-1.8
3Princeton3A6-6-081.1-1.7
4Midway3A9-2-081.1-0.2
5Rosewood2A4-8-055.1-3.8
6Goldsboro3A0-9-019.53.9

Swine Valley page, with conference records →

TAAC Six — 5 teams
SchoolClassRecordPowerSOS
1Northern Guilford6A9-4-093.313.9
2Asheboro6A10-2-089.77.3
3Eastern Guilford6A4-7-077.611.4
4Southeast Guilford6A2-7-067.56.4
5Southern Guilford5A0-9-033.67.2

TAAC Six page, with conference records →

Three Rivers — 7 teams
SchoolClassRecordPowerSOS
1West Craven4A9-3-094.23.5
2SouthWest Edgecombe4A9-3-081.42.4
3Eastern Wayne4A5-5-073.2-10.6
4Washington4A4-8-069.57.2
5North Pitt4A5-6-066.61.2
6North Johnston4A2-8-052.5-2.2
7North Lenoir4A0-10-040.1-1.8

Three Rivers page, with conference records →

Tobacco Road — 6 teams
SchoolClassRecordPowerSOS
1Southern School of Energy and Sustainability7A10-1-0109.26.8
2Hillside7A7-4-080.03.8
3Riverside7A2-8-056.32.2
4Northern6A5-6-055.2-7.7
5Chapel Hill7A3-8-046.31.1
6East Chapel Hill6A1-8-031.1-11.8

Tobacco Road page, with conference records →

Tri County — 6 teams
SchoolClassRecordPowerSOS
1Scotland6A11-1-0107.913.8
2Cape Fear7A8-3-094.78.8
3Gray's Creek6A7-5-075.77.3
4Terry Sanford6A4-8-075.415.0
5Purnell Swett7A3-7-066.81.0
6Lumberton7A2-9-064.611.9

Tri County page, with conference records →

Triangle Six — 6 teams
SchoolClassRecordPowerSOS
1Cardinal Gibbons7A9-3-0116.427.9
2Middle Creek6A10-2-0111.123.1
3Holly Springs7A6-6-086.217.4
4Sanderson7A6-6-083.811.3
5Cary7A3-7-066.411.6
6Felton Grove6A4-7-065.07.1

Triangle Six page, with conference records →

Western Foothills — 9 teams
SchoolClassRecordPowerSOS
1Hickory5A8-4-0107.015.8
2East Lincoln5A11-1-0105.113.2
3West Iredell4A10-2-095.36.9
4Maiden4A6-6-082.214.5
5Bunker Hill4A7-5-076.68.1
6Newton-Conover4A4-7-076.611.8
7Bandys4A3-8-075.015.5
8North Lincoln5A4-8-072.615.9
9Foard4A3-9-065.013.5

Western Foothills page, with conference records →

Western Highlands — 7 teams
SchoolClassRecordPowerSOS
1Hendersonville3A12-0-085.3-7.3
2Mountain Heritage3A8-4-074.6-6.3
3Mitchell2A8-4-072.0-7.6
4Owen3A5-6-058.6-10.4
5Polk County3A4-8-053.0-8.0
6Avery County2A3-8-045.2-13.4
7Madison3A1-9-036.2-9.9

Western Highlands page, with conference records →

Western Piedmont — 7 teams
SchoolClassRecordPowerSOS
1Hibriten4A12-0-097.7-7.4
2R-S Central4A8-4-074.2-5.4
3East Burke4A6-6-069.0-0.7
4Chase3A8-3-067.3-13.2
5East Rutherford3A3-8-063.83.5
6Patton3A1-10-037.6-6.1
7Draughn3A0-11-032.10.7

Western Piedmont page, with conference records →

Yadkin Valley — 7 teams
SchoolClassRecordPowerSOS
1North Stanly3A10-1-093.2-6.6
2North Rowan2A7-4-073.1-6.9
3Mountain Island Charter2A7-3-060.5-17.5
4Union Academy3A7-4-058.7-13.5
5Albemarle2A5-7-048.3-12.2
6South Stanly2A2-9-046.7-7.1
7Bonnie Cone Leadership Academy1A0-10-026.9-13.8

Yadkin Valley page, with conference records →

NCHSAA RPI Standings

The official NCHSAA RPI standings, as published by the association on October 31, 2026 (nchsaa.org, powered by MaxPreps): 0.4 win percentage, 0.4 opponents' win percentage, 0.2 opponents' opponents'. Records are NCHSAA's, which can differ from ours where the association has ruled on a forfeit. This table is more than a week old.

8A — 32 teams
SchoolRecordRPIPowerSOS
1Hough10-0-00.77696134.128.2
2Chambers9-1-00.71551117.826.6
3Millbrook9-0-10.71332123.224.6
4Mallard Creek8-2-00.69461117.034.1
5Apex Friendship10-0-00.6820398.011.5
6Hoggard9-1-00.67583116.219.0
7West Forsyth8-2-00.66243115.629.0
8Rolesville7-2-10.63639120.827.0
9Myers Park7-3-00.63611105.026.5
10Pinecrest7-3-00.63033100.024.5
11West Charlotte6-4-00.61574100.533.0
12Palisades8-2-00.60987105.119.8
13Green Hope8-2-00.5948990.45.9
14Jordan7-3-00.5861995.313.7
15Ardrey Kell7-3-00.5764493.416.5
16Leesville Road6-4-00.5665498.921.3
17Panther Creek6-4-00.5611784.914.9
18Laney5-5-00.5565092.325.3
19Hoke County5-5-00.5461189.223.2
20Providence5-5-00.5252891.020.2
21Broughton5-5-00.5042282.921.1
22Wakefield4-6-00.4789876.423.0
23South Mecklenburg4-6-00.4731979.217.9
24Willow Spring3-7-00.4486975.116.2
25Enloe4-6-00.4371179.618.9
26Northwest Guilford2-8-00.4187674.026.3
27Apex3-7-00.4105079.69.2
28East Mecklenburg4-6-00.4035672.98.2
29Corinth Holders2-8-00.3922280.219.7
30Athens Drive2-8-00.3662568.418.1
31Garinger2-8-00.3367250.88.5
32Green Level1-9-00.3226962.712.1
7A — 60 teams
SchoolRecordRPIPowerSOS
1Weddington10-0-00.76408127.524.5
2Grimsley10-0-00.75387126.720.6
3Lake Norman10-0-00.71111123.019.5
4Cleveland9-1-00.71100117.124.2
5Garner8-2-00.68978113.228.1
6Reagan8-2-00.68906117.626.1
7A L Brown10-0-00.67267102.411.4
8Marvin Ridge9-1-00.66653105.420.8
9Clayton8-2-00.66246114.120.9
10Southern School of Energy and Sustainability9-1-00.65865109.26.8
11New Bern7-3-00.6535299.323.5
12Wake Forest8-2-00.65081108.416.2
13Cardinal Gibbons7-3-00.63824116.427.9
14Page9-1-00.63506106.68.2
15East Forsyth7-3-00.62840111.227.7
16Cape Fear8-2-00.6133394.78.8
17D H Conley6-4-00.6097687.220.1
18Southeast Raleigh7-3-00.60683110.823.4
19Hickory Ridge8-2-00.60200106.27.8
20Davie County6-4-00.5937896.324.2
21Hillside7-3-00.5778680.03.8
22Mooresville5-5-00.57333102.126.9
23Ashley6-4-00.5532885.718.1
24West Cabarrus5-5-00.5420082.216.6
25Jack Britt5-5-00.5263387.821.9
26Holly Springs5-5-00.5239386.217.4
27South Central4-6-00.5225886.219.2
28Heritage5-5-00.5196179.114.8
29Richmond4-6-00.5077899.127.0
30Butler4-6-00.5048292.929.8
31Fuquay-Varina4-6-00.5003386.623.5
32Topsail4-6-00.4971585.122.1
33North Brunswick5-5-00.4864479.114.4
34Hopewell5-5-00.4771180.714.7
35Sanderson5-5-00.4748983.811.3
36Porter Ridge3-7-00.4651983.825.9
37Independence2-8-00.4485385.829.6
38Overhills4-6-00.4470079.513.2
39Ballantyne Ridge4-6-00.4332176.810.6
40R J Reynolds4-6-00.4320676.811.3
41Pine Forest3-7-00.4265672.817.7
42South Garner3-7-00.4265683.918.8
43Parkland3-7-00.4120666.89.8
44New Hanover2-8-00.4112575.121.2
45South Iredell2-8-00.3957873.722.1
46Lumberton2-8-00.3942264.611.9
47Chapel Hill3-7-00.3938446.31.1
48East Wake3-7-00.3921568.18.0
49North Mecklenburg3-7-00.3869785.116.7
50Purnell Swett3-7-00.3783366.81.0
51Cary3-7-00.3739466.411.6
52Southwest Guilford2-8-00.3713360.311.4
53West Mecklenburg2-8-00.3703270.712.9
54Cuthbertson1-9-00.3627565.719.9
55Riverside2-8-00.3601456.32.2
56Cox Mill2-8-00.3493364.39.3
57McDowell1-9-00.3391951.71.6
58Smithfield-Selma0-10-00.3238355.721.0
59Knightdale1-9-00.3230258.69.2
60Rocky River0-10-00.2442249.18.7
6A — 58 teams
SchoolRecordRPIPowerSOS
1Junius H Rose10-0-00.77494115.923.1
2Asheville9-1-00.72742100.014.8
3Jacksonville7-2-00.69647114.118.1
4Northern Nash8-2-00.69008114.516.8
5Scotland9-1-00.68619107.913.8
6Union Pines9-1-00.6831598.47.1
7Southern Alamance8-2-00.6748395.214.5
8Roberson8-2-00.66492107.812.1
9Williams6-2-00.6639591.116.1
10Middle Creek8-2-00.66186111.123.1
11Asheboro9-1-00.6531689.77.3
12Seventy-First9-1-00.64111103.99.7
13Triton9-1-00.6408182.92.8
14Kings Mountain7-3-00.61297107.516.2
15Mount Tabor6-4-00.5951996.521.5
16Harnett Central8-2-00.5935988.2-1.2
17Franklinton8-2-00.5872586.2-0.7
18Alexander Central8-2-00.5833385.54.4
19Freedom8-2-00.5815683.6-0.6
20Swansboro7-3-00.5809676.32.3
21Dudley6-4-00.5578594.919.3
22Sun Valley5-5-00.5547591.724.3
23Charlotte Catholic6-4-00.5487494.219.8
24Northern Guilford6-4-00.5481393.313.9
25Ashbrook5-5-00.5437893.817.9
26Westover6-4-00.5344487.310.5
27Watauga5-5-00.5137880.88.1
28Glenn6-4-00.5133979.47.6
29Ragsdale5-5-00.5017286.111.4
30Gray's Creek6-4-00.4942275.77.3
31Reynolds3-7-00.4803176.815.5
32Statesville4-6-00.4688983.414.2
33South Johnston4-6-00.4671172.06.1
34Felton Grove4-6-00.4619165.07.1
35Phillip O Berry Academy of Technology5-5-00.4573366.69.1
36Northern5-5-00.4568355.2-7.7
37Eastern Guilford3-6-00.4541277.611.4
38Olympic4-6-00.4480075.912.8
39West Johnston4-6-00.4435966.46.4
40Central Cabarrus3-7-00.4302273.611.3
41White Oak2-7-00.4268365.315.7
42Terry Sanford3-7-00.4222275.415.0
43South Caldwell3-7-00.4200054.97.7
44Piedmont3-7-00.4183173.114.5
45Western Harnett4-6-00.4140852.4-5.0
46South View3-7-00.4122278.211.9
47Saint Stephens3-7-00.4120073.44.5
48Lee County2-8-00.4113765.09.5
49Western Guilford3-7-00.4059656.27.6
50West Brunswick2-8-00.4051272.112.1
51Southeast Guilford3-7-00.3931467.56.4
52Vance County1-9-00.3782157.012.8
53E E Smith2-8-00.3606973.48.0
54Harding University2-8-00.3603265.511.1
55Ben L. Smith1-9-00.3259452.59.9
56North Iredell0-10-00.3064440.215.7
57Southern Lee0-10-00.3042641.08.7
58East Chapel Hill1-8-00.2912831.1-11.8
5A — 57 teams
SchoolRecordRPIPowerSOS
1Southeast Alamance10-0-00.7441699.38.3
2Crest9-1-00.73978110.822.1
3Northside10-0-00.72592107.412.9
4Franklin10-0-00.7146498.16.1
5Jay M Robinson10-0-00.70850111.25.9
6South Point9-1-00.70528108.819.1
7Hunt9-1-00.7005391.913.7
8Monroe8-2-00.67422107.016.3
9West Rowan8-2-00.6697889.59.5
10East Lincoln9-1-00.66689105.113.2
11Croatan9-1-00.6628993.85.0
12Seaforth9-1-00.6411782.3-9.2
13Oak Grove8-2-00.63764109.814.3
14Hickory7-3-00.62667107.015.8
15Forest Hills8-2-00.6261484.86.5
16Fike8-2-00.62222100.76.1
17Enka8-2-00.6179182.02.4
18Eastern Alamance7-2-00.6177895.010.7
19Northwest Cabarrus7-3-00.5951181.86.1
20Smoky Mountain8-2-00.5921790.1-0.7
21Havelock5-5-00.5868994.318.3
22North Davidson7-3-00.5730689.58.1
23Rocky Mount6-4-00.5623384.19.2
24Orange6-4-00.5370668.3-5.7
25West Henderson5-5-00.5293674.45.8
26Saint Pauls7-3-00.5257884.11.5
27Parkwood5-5-00.5252381.314.4
28South Granville6-4-00.5190767.9-6.9
29Western Alamance5-5-00.5163279.18.9
30Erwin4-6-00.5051476.110.0
31Montgomery Central5-5-00.5042376.46.7
32Southern Nash4-6-00.5024576.914.7
33West Carteret4-6-00.4917866.510.4
34Carson4-6-00.4783668.83.9
35Currituck County4-6-00.4728064.8-0.4
36Rockingham County4-6-00.4680069.3-2.2
37J. F. Webb4-6-00.4583357.3-10.9
38Southern Wayne4-6-00.4554557.94.1
39South Brunswick5-5-00.4553463.1-8.8
40East Rowan4-6-00.4546762.92.7
41North Buncombe4-6-00.4421764.31.6
42North Lincoln3-7-00.4364472.615.9
43North Henderson2-8-00.4315665.67.7
44Person2-8-00.4225666.911.5
45Forestview2-8-00.4171466.115.1
46Huss3-7-00.4089877.014.0
47Richlands2-8-00.4020560.88.0
48Charles B Aycock2-8-00.3961763.77.1
49Concord1-9-00.3657856.45.8
50Atkins2-8-00.3657249.17.0
51Dixon2-8-00.3643165.34.0
52Northeast Guilford1-9-00.3614484.518.9
53North Forsyth Magnet1-9-00.3277148.06.6
54North Gaston0-10-00.2937836.513.1
55Southern Guilford1-9-00.2891033.67.2
56Cedar Ridge1-7-00.2855519.1-18.1
57Douglas Byrd0-10-00.2651737.04.8
4A — 55 teams
SchoolRecordRPIPowerSOS
1East Duplin9-1-00.6771489.01.4
2Hibriten10-0-00.6703597.7-7.4
3Tuscola9-1-00.6695892.23.2
4West Iredell9-1-00.6575695.36.9
5T Wingate Andrews9-1-00.6398992.7-0.1
6Clinton7-3-00.6317976.1-1.5
7West Craven8-2-00.6224094.23.5
8Burns7-3-00.6106795.07.2
9Mount Pleasant7-3-00.6084479.38.7
10West Stokes8-2-00.6063187.72.8
11Reidsville7-3-00.5991495.52.2
12SouthWest Edgecombe7-3-00.5952381.42.4
13Stuart W Cramer8-2-00.5882298.3-2.6
14Lake Norman Charter7-3-00.5802270.6-2.9
15R-S Central7-3-00.5667074.2-5.4
16Pisgah6-4-00.5607875.52.3
17South Rowan6-4-00.5380069.6-3.5
18Wilkes Central7-3-00.5378179.2-9.3
19Morehead7-3-00.5374763.8-7.9
20Bunker Hill6-4-00.5295676.68.1
21Southwestern Randolph7-3-00.5256570.2-14.6
22West Stanly4-6-00.5211765.67.8
23Maiden5-5-00.5202282.214.5
24Fairmont5-5-00.5172868.6-3.7
25East Burke5-5-00.5141469.0-0.7
26Roanoke Rapids5-5-00.5053859.6-11.3
27North Surry5-5-00.4989665.8-5.2
28Nash Central4-6-00.4940564.61.4
29Randleman4-6-00.4802371.54.7
30Newton-Conover4-6-00.4791776.611.8
31Ledford4-6-00.4772568.25.4
32North Pitt5-5-00.4740366.61.2
33Salisbury3-7-00.4728956.29.4
34East Gaston5-5-00.4682257.3-0.1
35Bunn5-5-00.4673564.3-10.6
36Washington3-7-00.4601169.57.2
37Eastern Wayne5-4-00.4459973.2-10.6
38Anson4-6-00.4445669.90.8
39Southwest4-6-00.4401068.1-2.5
40Bandys3-7-00.4384475.015.5
41Forbush4-6-00.4206952.7-10.0
42Jordan-Matthews4-6-00.4078336.7-16.7
43Foard2-8-00.4057865.013.5
44Cummings1-9-00.3979057.09.5
45Central Davidson3-7-00.3904765.51.1
46Lincoln Charter2-8-00.3900841.7-5.1
47Lexington2-8-00.3733762.90.2
48Carver3-7-00.3700638.9-12.0
49East Henderson1-9-00.3508948.02.4
50Ashe County1-9-00.3464739.6-1.9
51North Johnston2-8-00.3415452.5-2.2
52Brevard1-9-00.3393652.66.1
53Red Springs2-8-00.3289532.1-2.5
54Carrboro1-9-00.2917830.3-17.6
55North Lenoir0-10-00.2505040.1-1.8
3A — 53 teams
SchoolRecordRPIPowerSOS
1Northeastern9-1-00.7140591.64.4
2Whiteville9-0-00.7135283.4-8.2
3North Stanly10-0-00.7049793.2-6.6
4Shelby9-1-00.69067102.34.6
5Midway8-1-00.6717281.1-0.2
6Hendersonville10-0-00.6697585.3-7.3
7James Kenan8-1-00.6612189.5-1.6
8Walkertown9-1-00.6351284.7-8.9
9Martin County7-3-00.6261782.80.5
10Eastern Randolph7-3-00.6224086.80.0
11Thomasville9-1-00.6128083.0-10.3
12Mount Airy7-3-00.6054781.58.1
13Chase8-2-00.5833167.3-13.2
14Lincolnton7-3-00.5737895.52.8
15Mountain Heritage7-3-00.5694274.6-6.3
16Hertford County6-4-00.5684377.63.9
17West Wilkes7-3-00.5566468.2-7.6
18Union Academy7-3-00.5540858.7-13.5
19Pasquotank County6-4-00.5537270.91.0
20Wallace-Rose Hill5-4-00.5521685.0-1.8
21Farmville Central6-4-00.5439870.21.4
22Providence Grove6-4-00.5420367.1-9.4
23West Davidson7-3-00.5358170.5-11.0
24South Columbus6-4-00.5292666.4-4.4
25Louisburg Magnet7-3-00.5208860.3-15.7
26Princeton5-5-00.5157781.1-1.7
27Northwood5-5-00.5141564.5-2.7
28Wake Preparatory Academy6-4-00.5136160.3-13.7
29Greene Central6-4-00.4974678.5-6.9
30Owen5-5-00.4810358.6-10.4
31East Surry4-6-00.4740666.9-0.0
32East Rutherford3-7-00.4654063.83.5
33North Wilkes4-6-00.4462562.4-8.9
34Kinston5-5-00.4427372.4-5.5
35Pine Lake Preparatory4-6-00.4189249.0-10.7
36Pender4-6-00.4158267.8-8.8
37West Lincoln3-7-00.4013364.21.9
38Wheatmore3-7-00.3989754.7-13.5
39Polk County3-7-00.3984353.0-8.0
40East Davidson3-7-00.3900841.7-10.1
41North Moore0-10-00.3629233.31.1
42Ayden-Grifton2-8-00.3614256.61.2
43McMichael2-8-00.3569425.4-10.0
44South Lenoir3-7-00.3471337.2-13.0
45Heide Trask2-8-00.3394437.2-8.8
46Patton1-9-00.3266737.6-6.1
47Draughn0-10-00.3261432.10.7
48Bessemer City1-9-00.3253337.13.7
49Madison1-9-00.3085136.2-9.9
50Trinity1-9-00.3071925.0-10.5
51Bartlett Yancey1-9-00.2931532.5-11.6
52Goldsboro0-10-00.2902119.53.9
53Beddingfield0-10-00.2653928.5-3.9
2A — 45 teams
SchoolRecordRPIPowerSOS
1Corvian Community9-1-00.6820092.3-0.2
2Starmount9-1-00.6715387.7-6.7
3Tarboro9-1-00.6699197.0-2.2
4Holmes8-1-00.6618888.8-10.4
5Warren County10-0-00.6502688.9-22.2
6Murphy8-2-00.6171982.8-6.2
7Community School of Davidson7-3-00.6115883.2-3.8
8Alleghany7-3-00.6076573.3-5.2
9North Rowan7-3-00.5931973.1-6.9
10Lakewood7-3-00.5907462.7-14.9
11Manteo7-3-00.5822057.5-13.6
12Mountain Island Charter8-2-00.5725260.5-17.5
13East Bladen7-3-00.5698761.1-13.6
14East Wilkes6-4-00.5593182.0-1.4
15Christ the King7-3-00.5581072.3-8.1
16Mitchell7-3-00.5462872.0-7.6
17Southside7-3-00.5437145.9-24.0
18Cherokee6-4-00.5291161.2-8.0
19Cherryville6-4-00.5178170.6-5.0
20Gates County5-5-00.5096661.9-8.9
21North Duplin Jr Sr5-4-00.4877853.6-21.0
22West Columbus5-5-00.4751852.6-12.1
23Bertie3-7-00.4633446.9-4.0
24Albemarle4-6-00.4531948.3-12.2
25Camden County4-6-00.4506352.2-13.9
26South Stokes5-5-00.4468640.3-24.8
27Northwest Halifax Collegiate and Technical Academy5-5-00.4467236.3-27.3
28East Carteret4-6-00.4294145.5-18.0
29Hobbton3-7-00.4247259.1-9.4
30Rosewood3-7-00.4043255.1-3.8
31Swain County2-8-00.3930053.0-5.2
32Langtree Charter Academy3-7-00.3871447.5-10.7
33Pamlico County3-7-00.3860929.4-22.9
34Perquimans County2-8-00.3788445.6-13.6
35Avery County3-7-00.3783045.2-13.4
36Bishop McGuinness3-7-00.3680542.3-25.4
37South Stanly2-8-00.3605346.7-7.1
38Union3-7-00.3547439.4-22.6
39Bradford Preparatory2-8-00.3495641.8-12.3
40Elkin2-8-00.3395629.1-9.5
41Lejeune2-7-00.3268530.0-29.8
42Hayesville1-8-00.3068234.9-9.9
43American Leadership Academy - Johnston1-8-00.3043030.2-16.2
44Triangle Math and Science Academy1-6-00.297099.7-32.8
45Highland Tech0-10-00.2768926.61.0
1A — 24 teams
SchoolRecordRPIPowerSOS
1Northside10-0-00.6599476.9-26.1
2Chatham Central10-0-00.6516055.3-31.0
3Wilson Preparatory Academy6-4-00.5849071.7-5.2
4Hobgood Charter7-2-00.5630042.3-39.6
5Robbinsville5-5-00.5210076.8-7.4
6Sallie B Howard5-3-00.5142844.1-27.7
7North Edgecombe6-4-00.5119743.7-23.3
8Winston-Salem Preparatory Acad6-4-00.5010551.0-23.0
9East Columbus Junior-Senior4-6-00.4757845.9-14.6
10South Davidson Middle and6-4-00.4630244.9-32.0
11North East Carolina Prep5-5-00.4371936.2-34.5
12Rosman5-5-00.4324553.4-15.4
13Southeast Collegiate Prep Academy4-6-00.4228342.8-27.8
14KIPP Pride3-7-00.3963327.2-23.4
15Rocky Mount Preparatory4-6-00.3930135.9-32.6
16Columbia2-3-00.3585321.3-34.0
17College Prep and Leadership Academy2-7-00.3576232.0-25.6
18Washington County2-7-00.3574739.6-26.5
19Bonnie Cone Leadership Academy1-9-00.3323126.9-13.8
20Andrews1-8-00.3099933.1-8.6
21Bear Grass Charter1-8-00.2942622.6-33.5
22North Stokes0-10-00.2530724.4-21.3
23Weldon STEM0-9-00.2425916.1-26.5
24Jones0-10-00.230206.2-32.5

Playoff Picture

Projected playoffs → every round of every bracket, with projected scores.

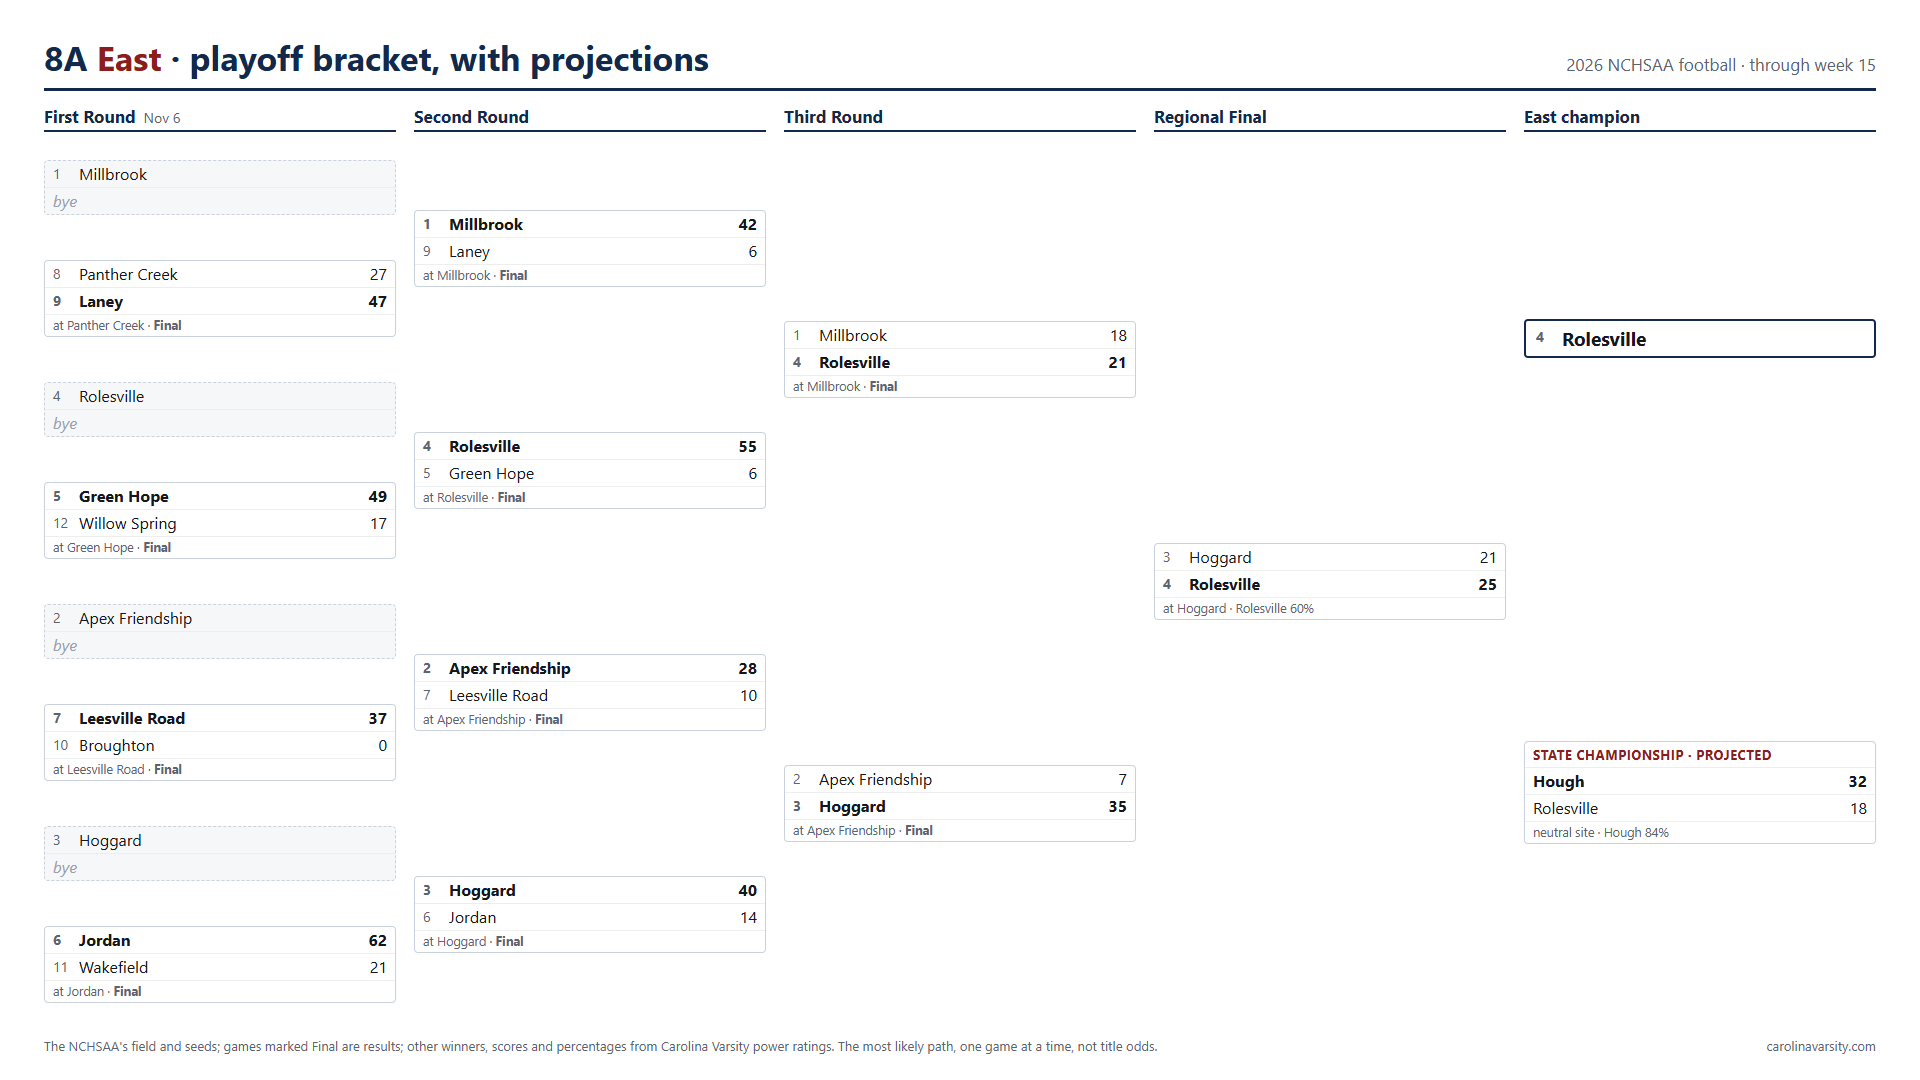
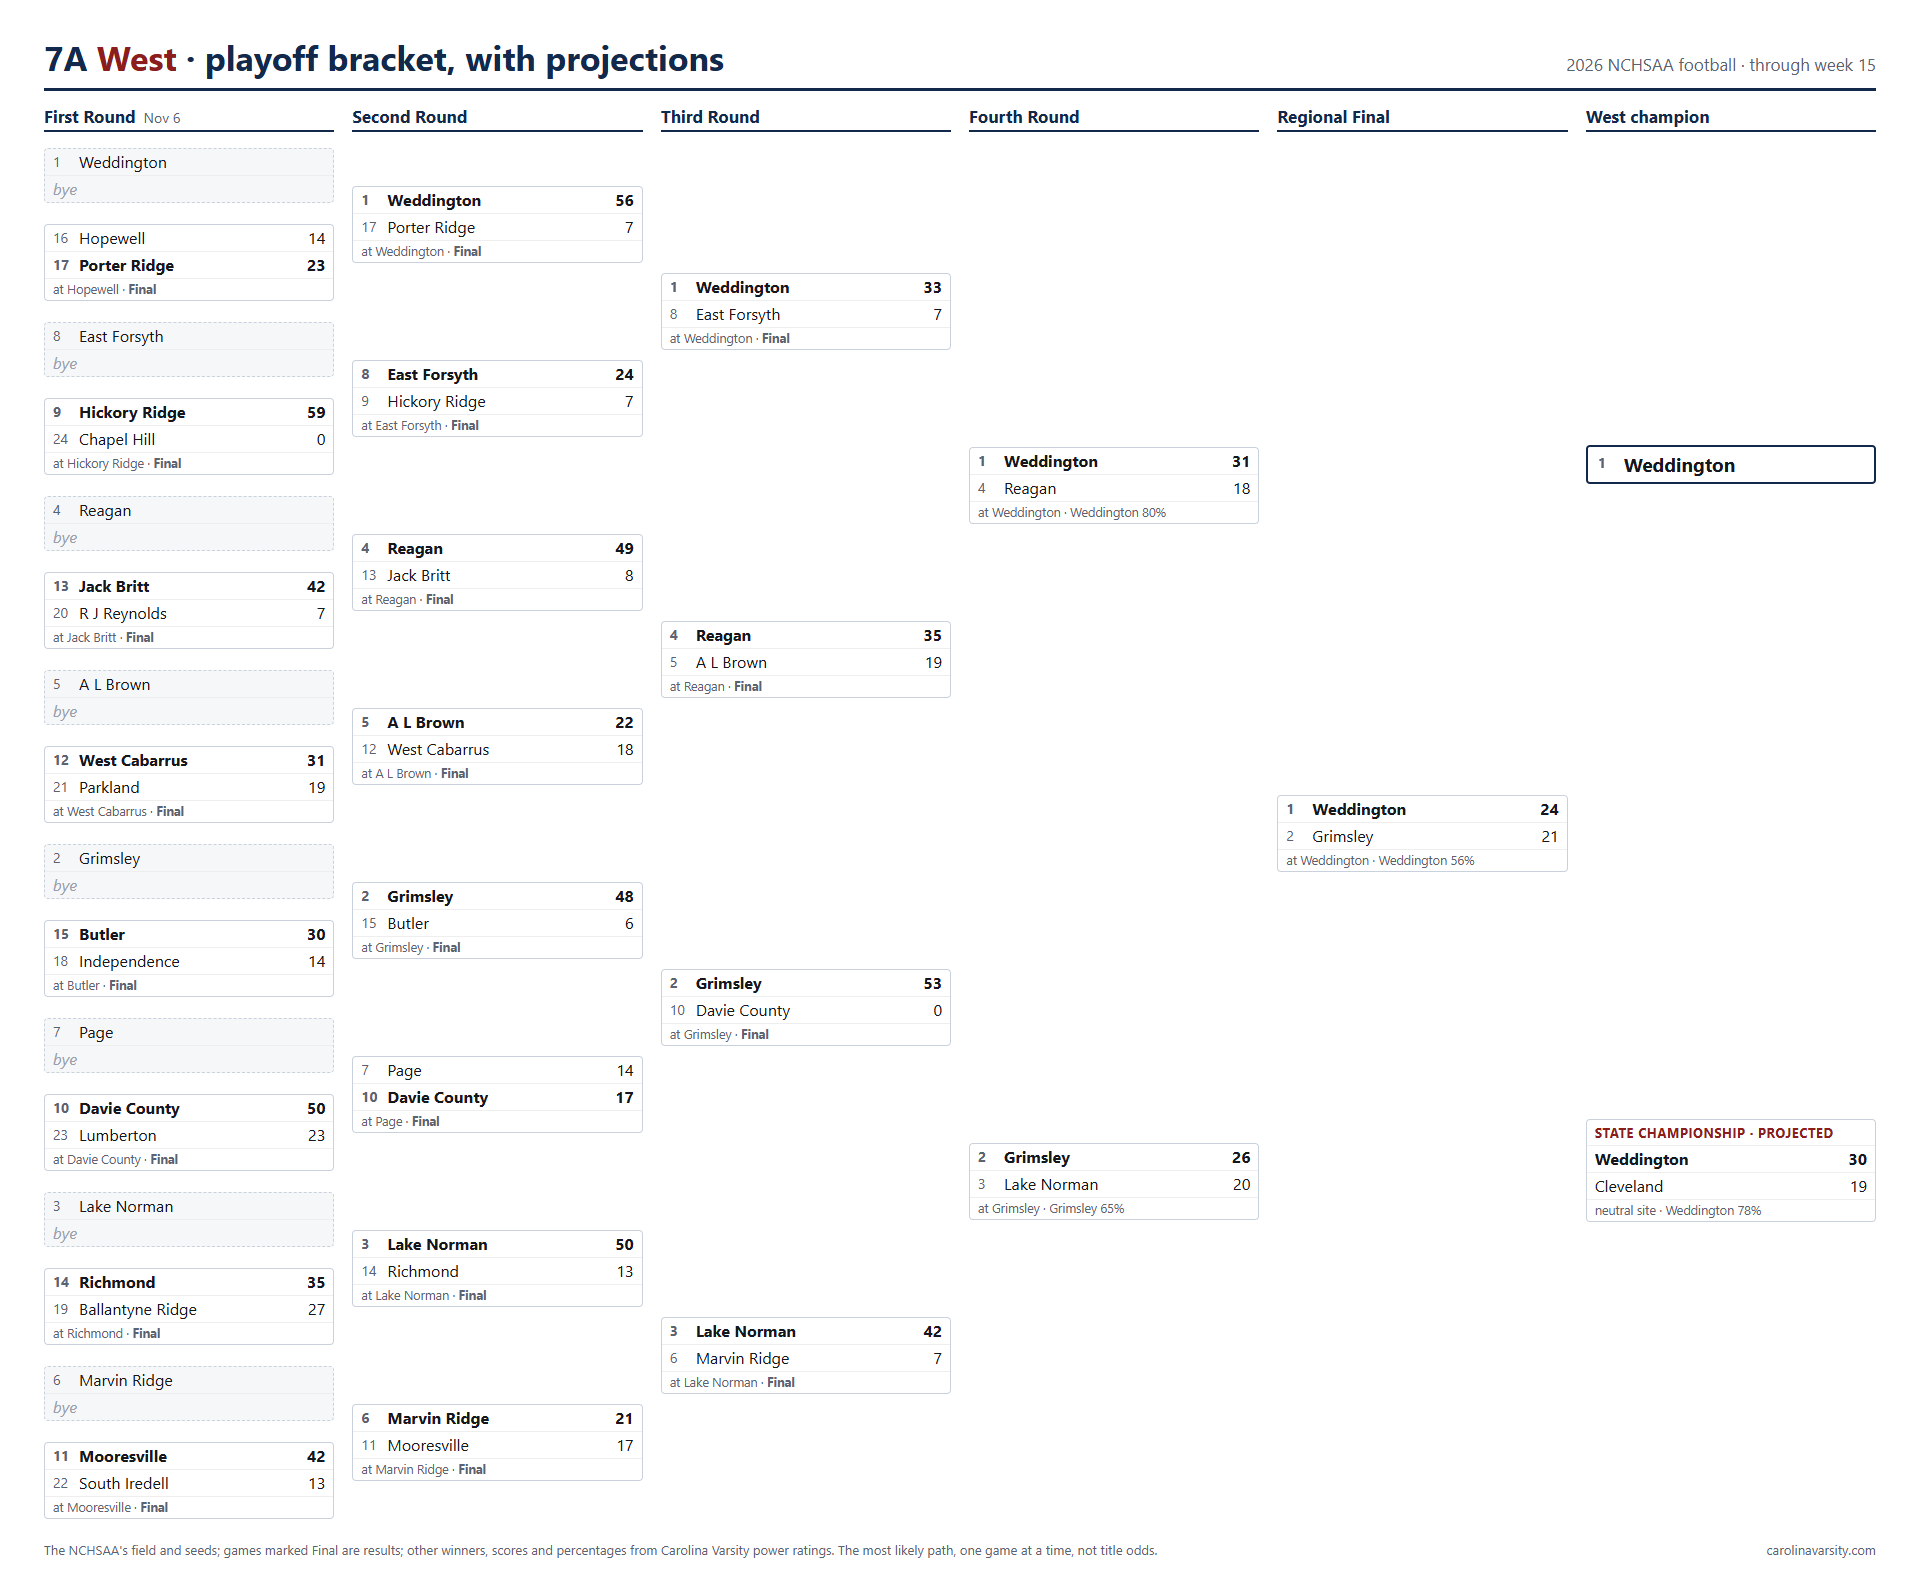
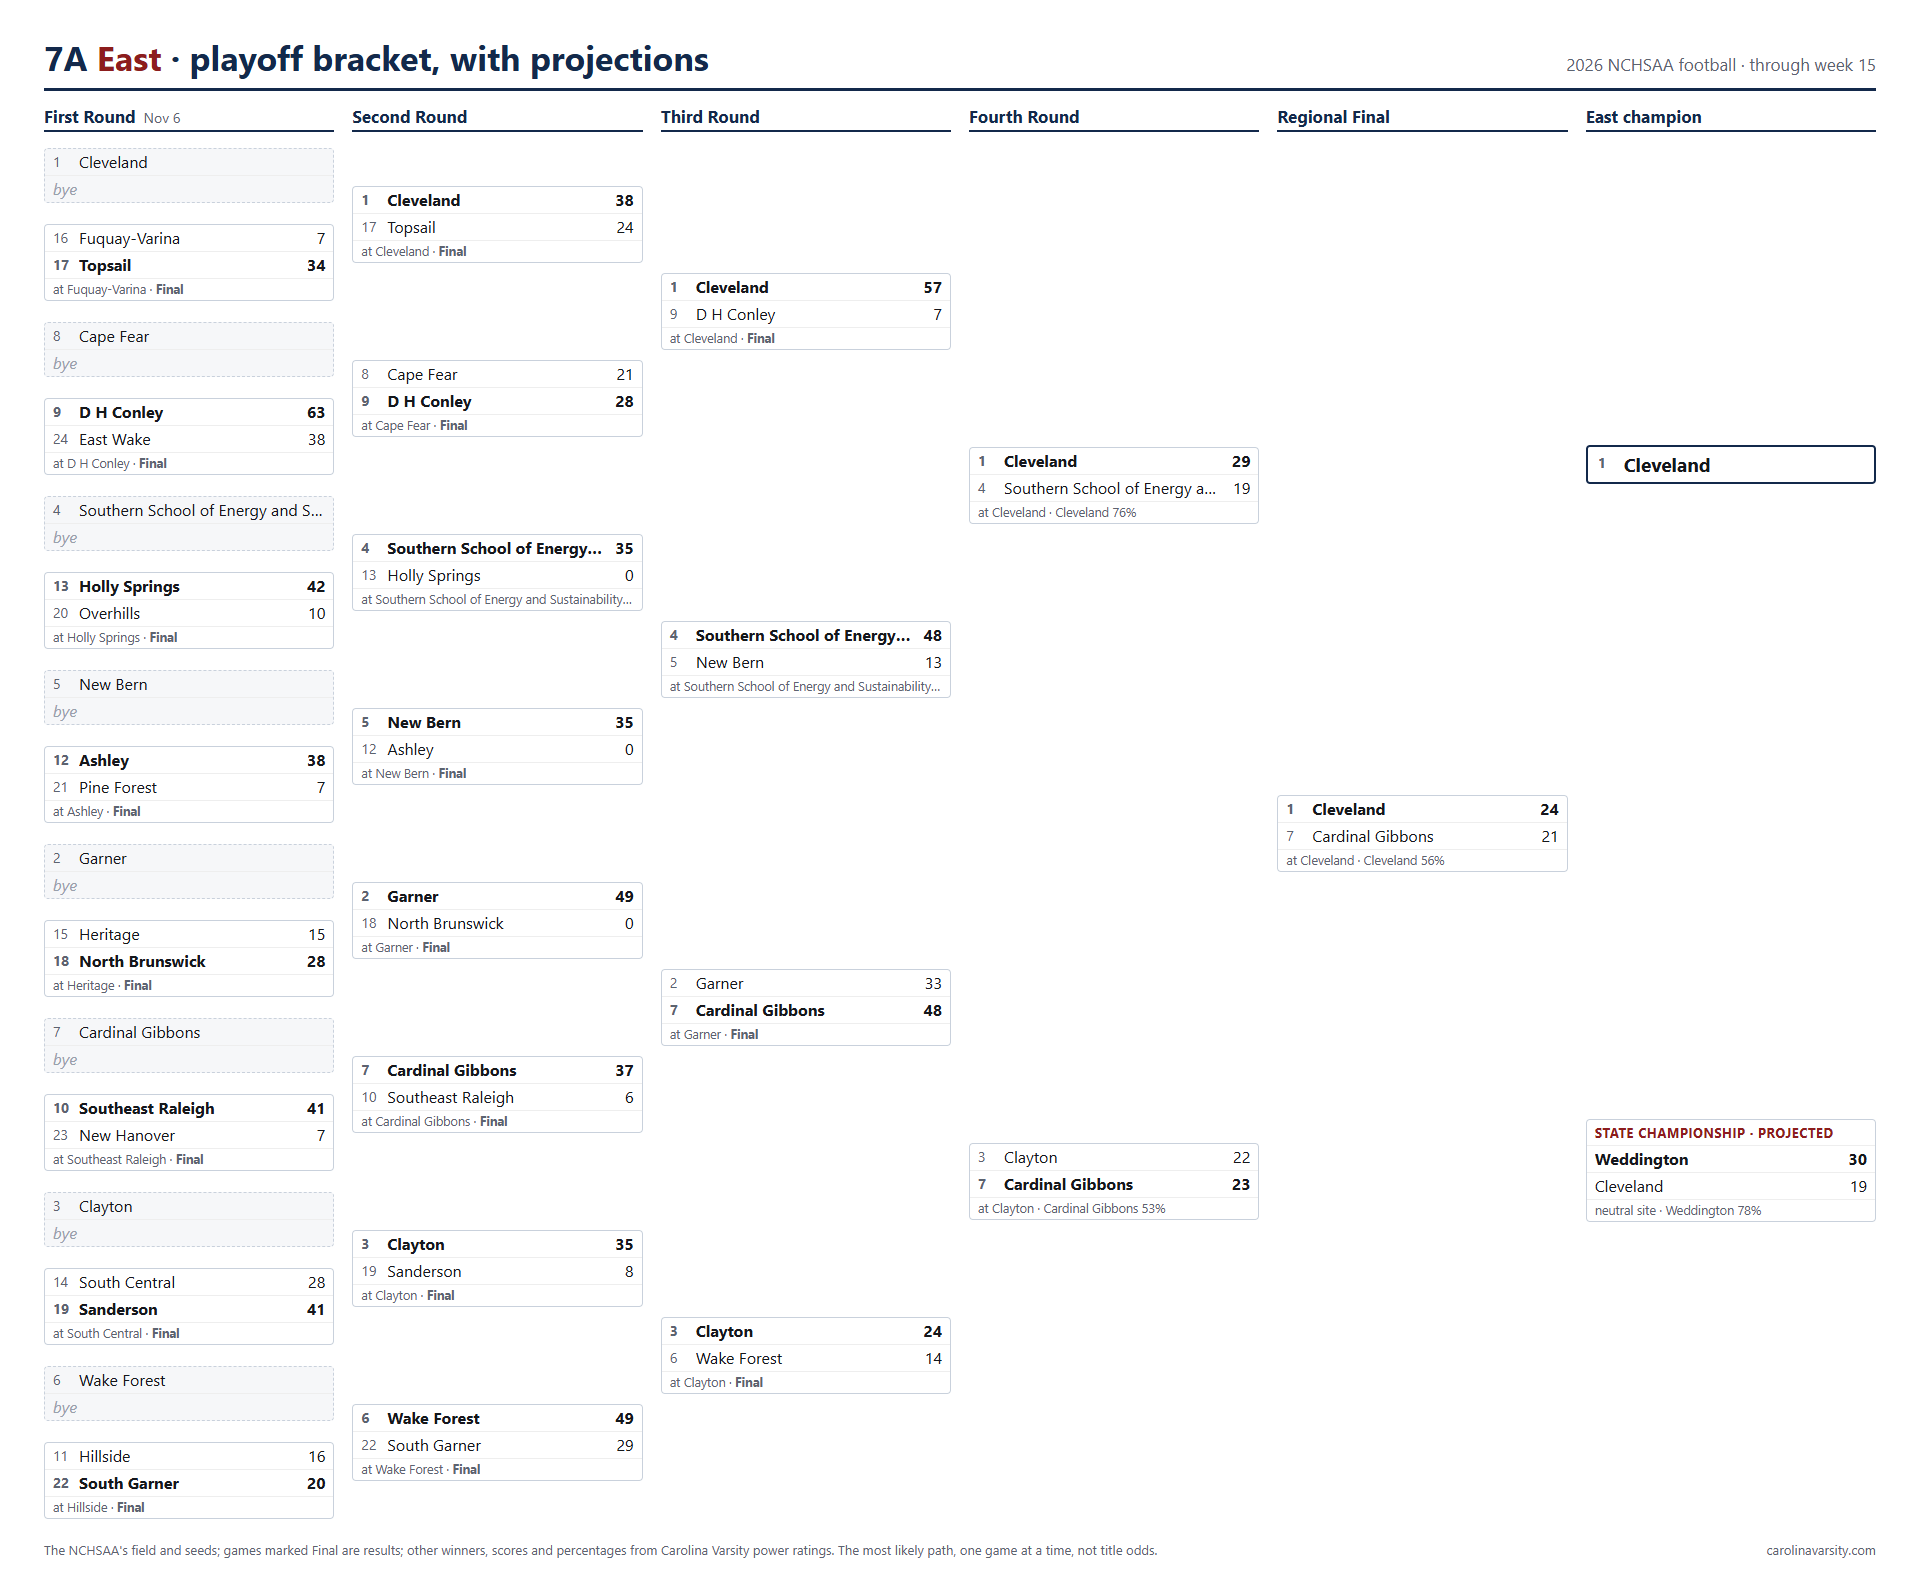
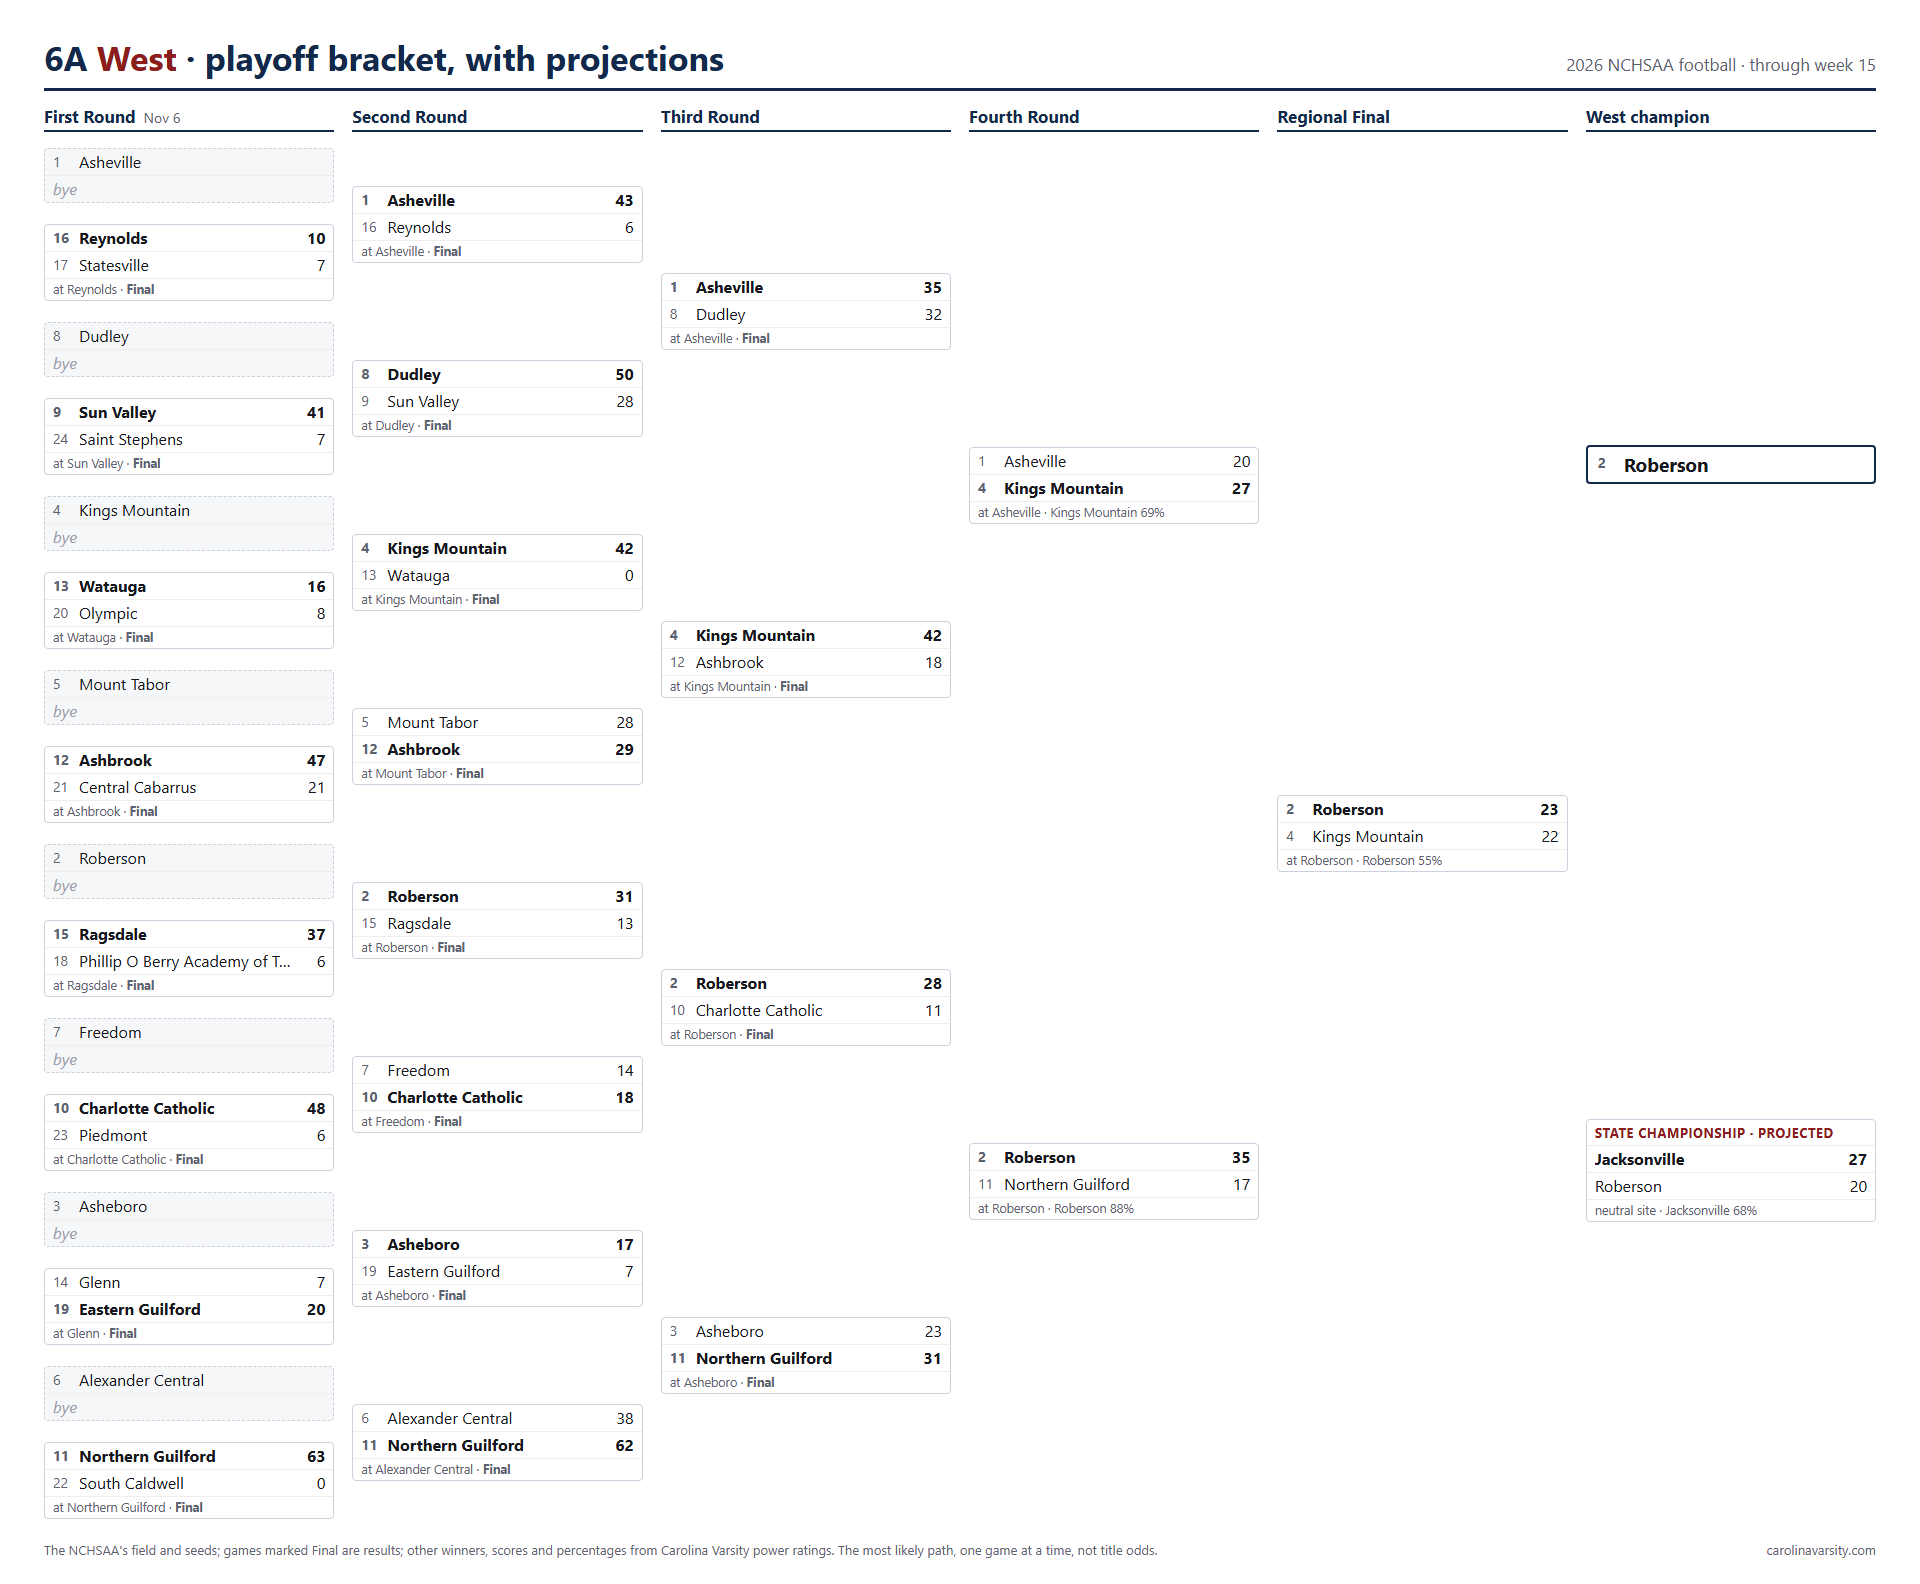
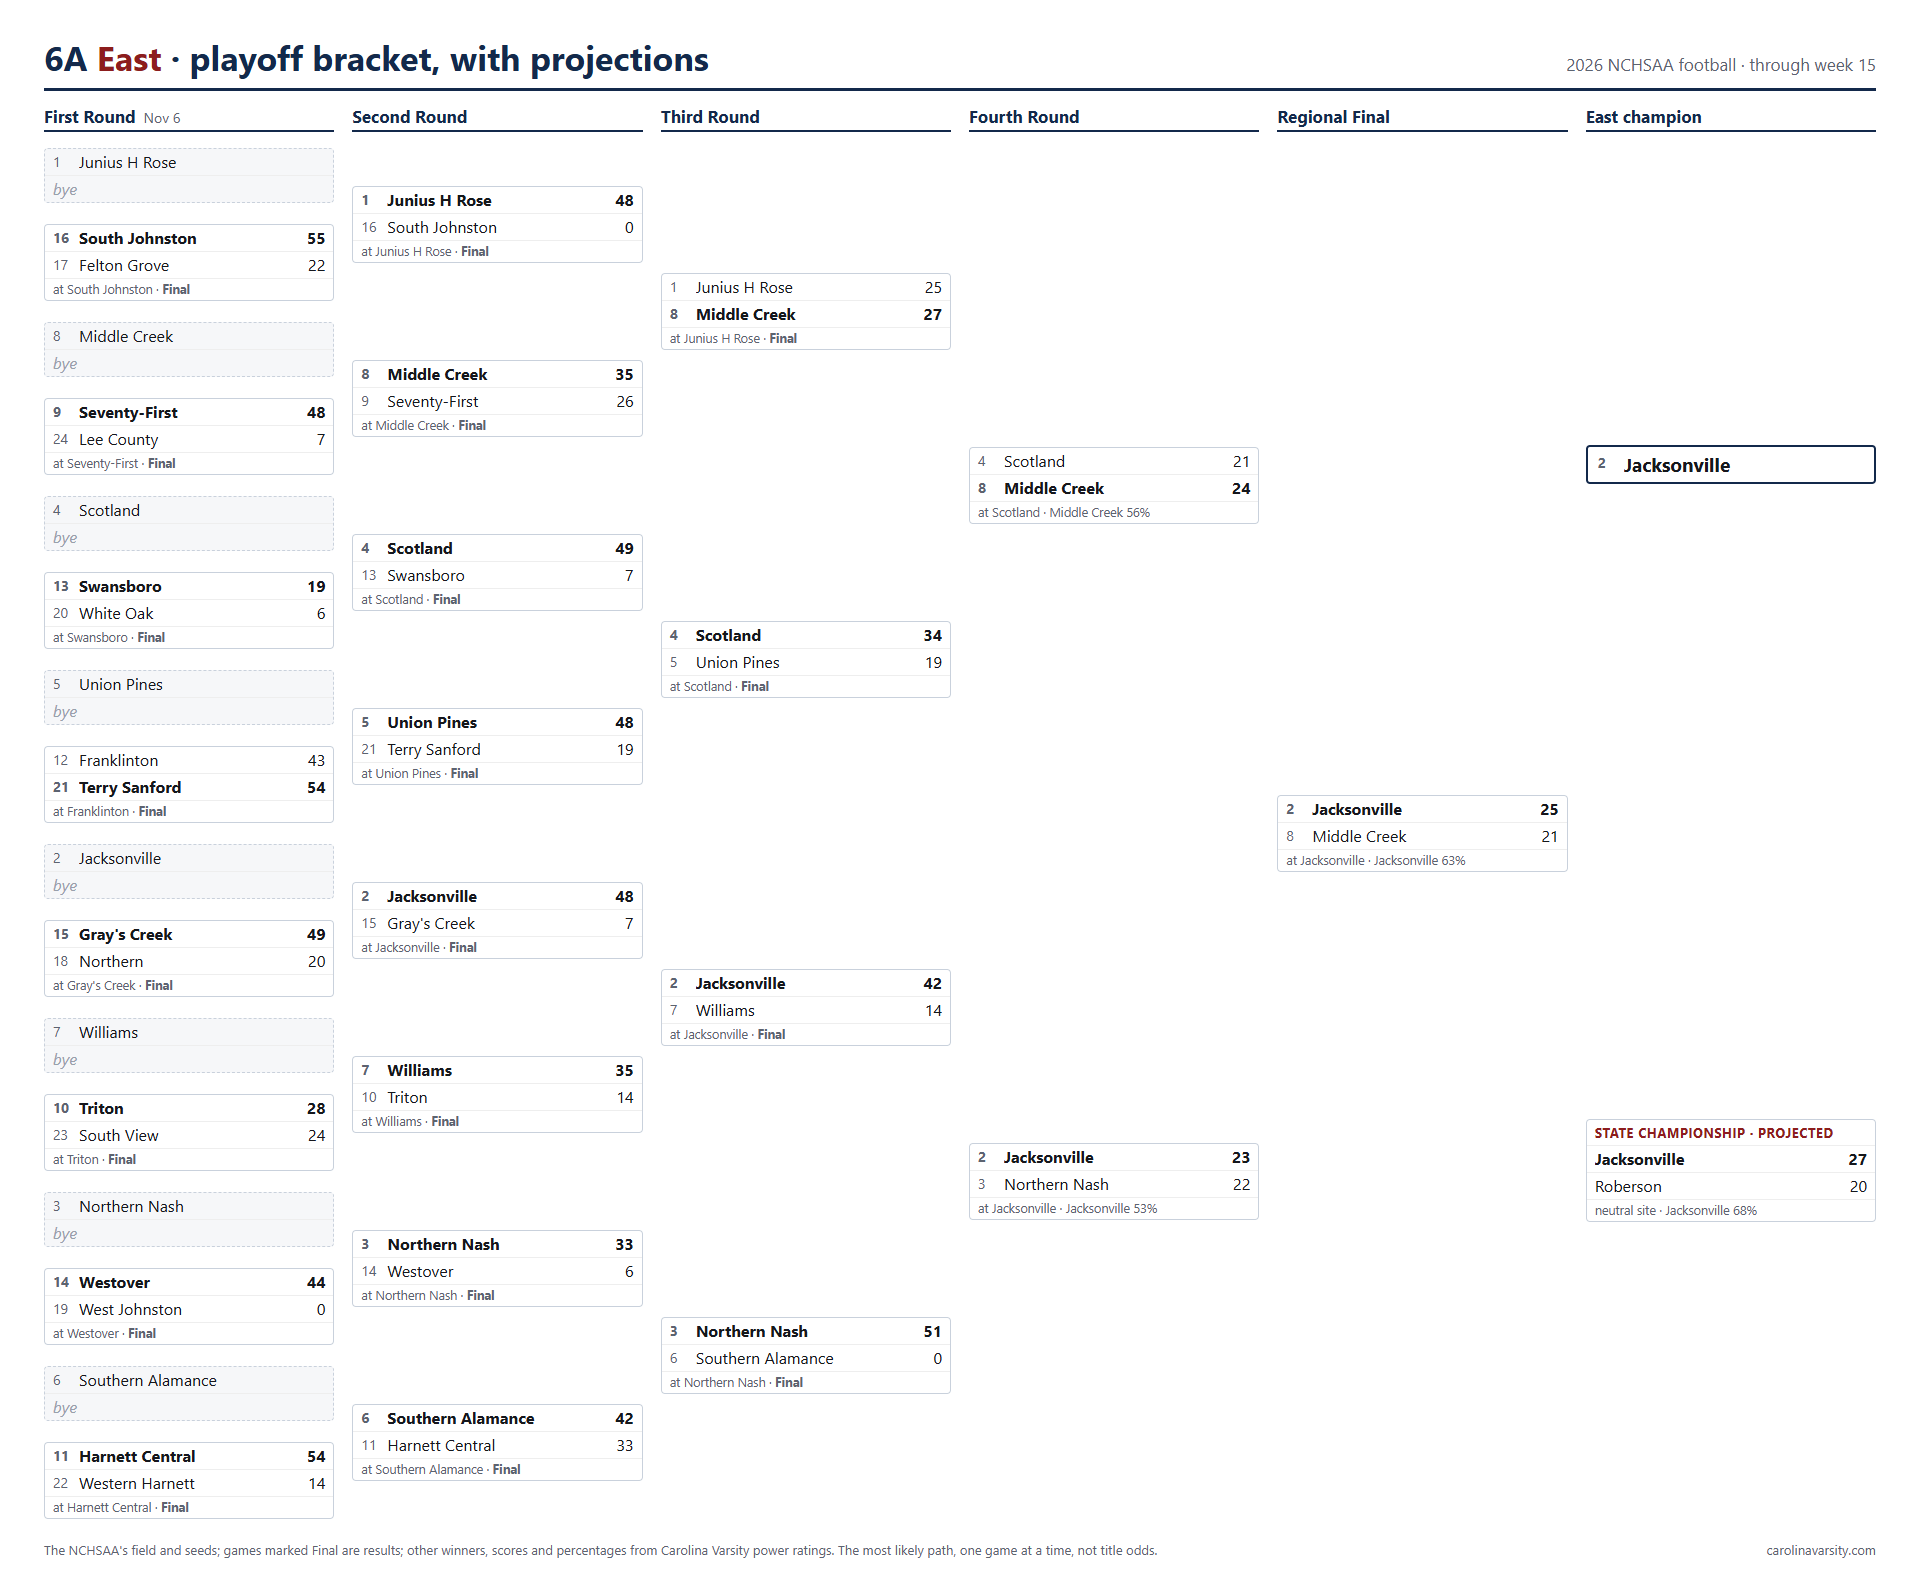
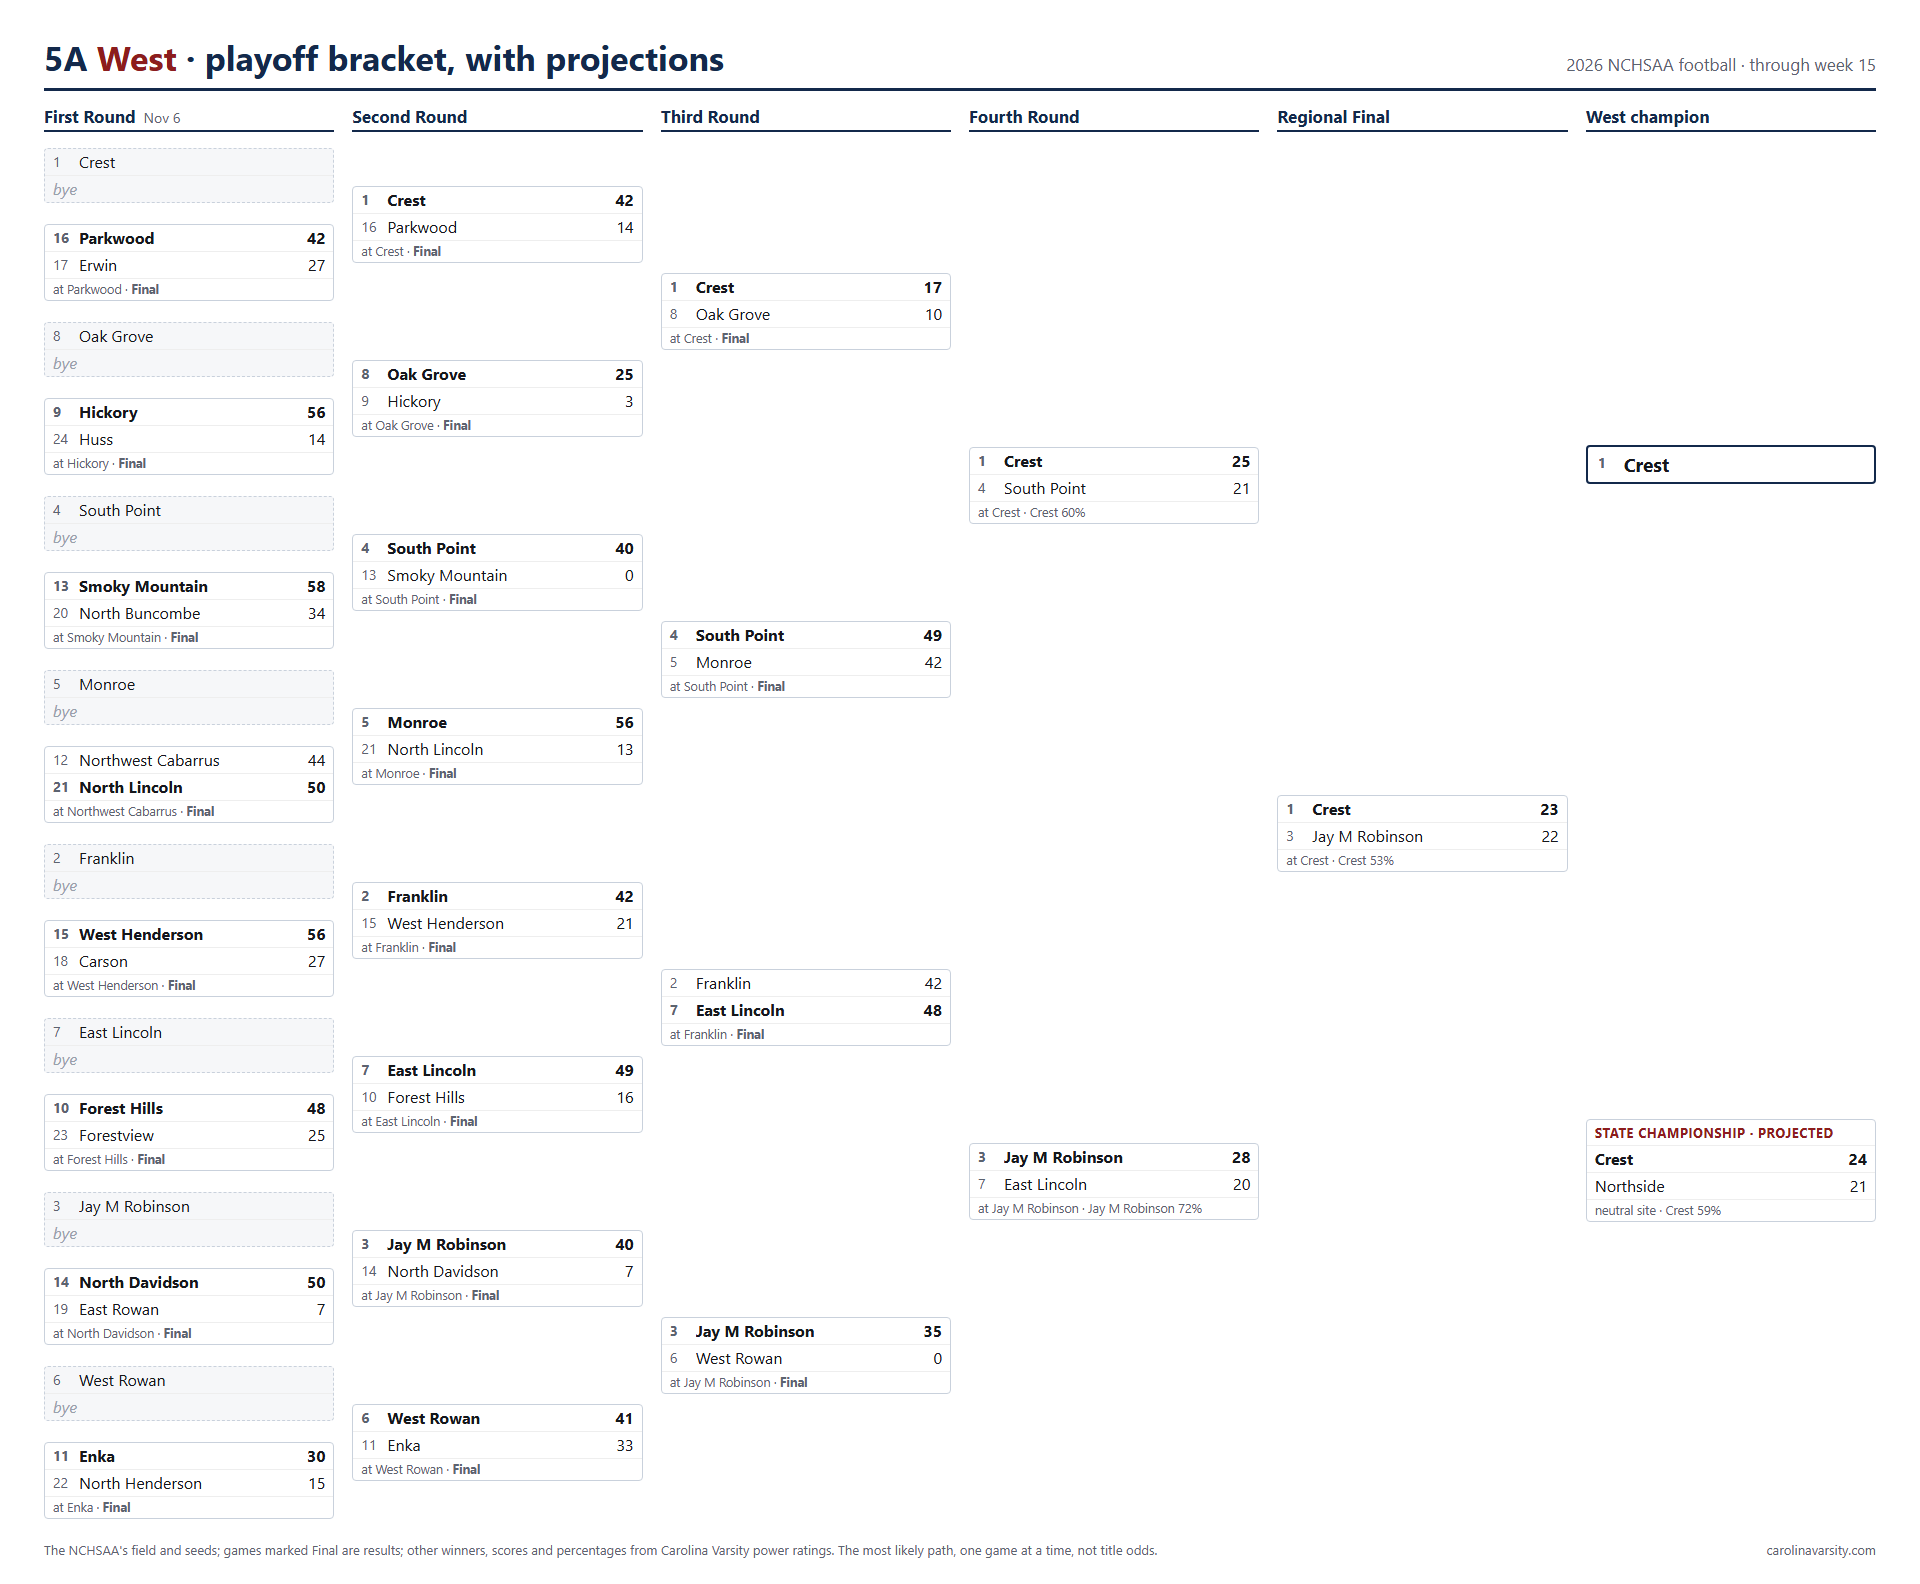
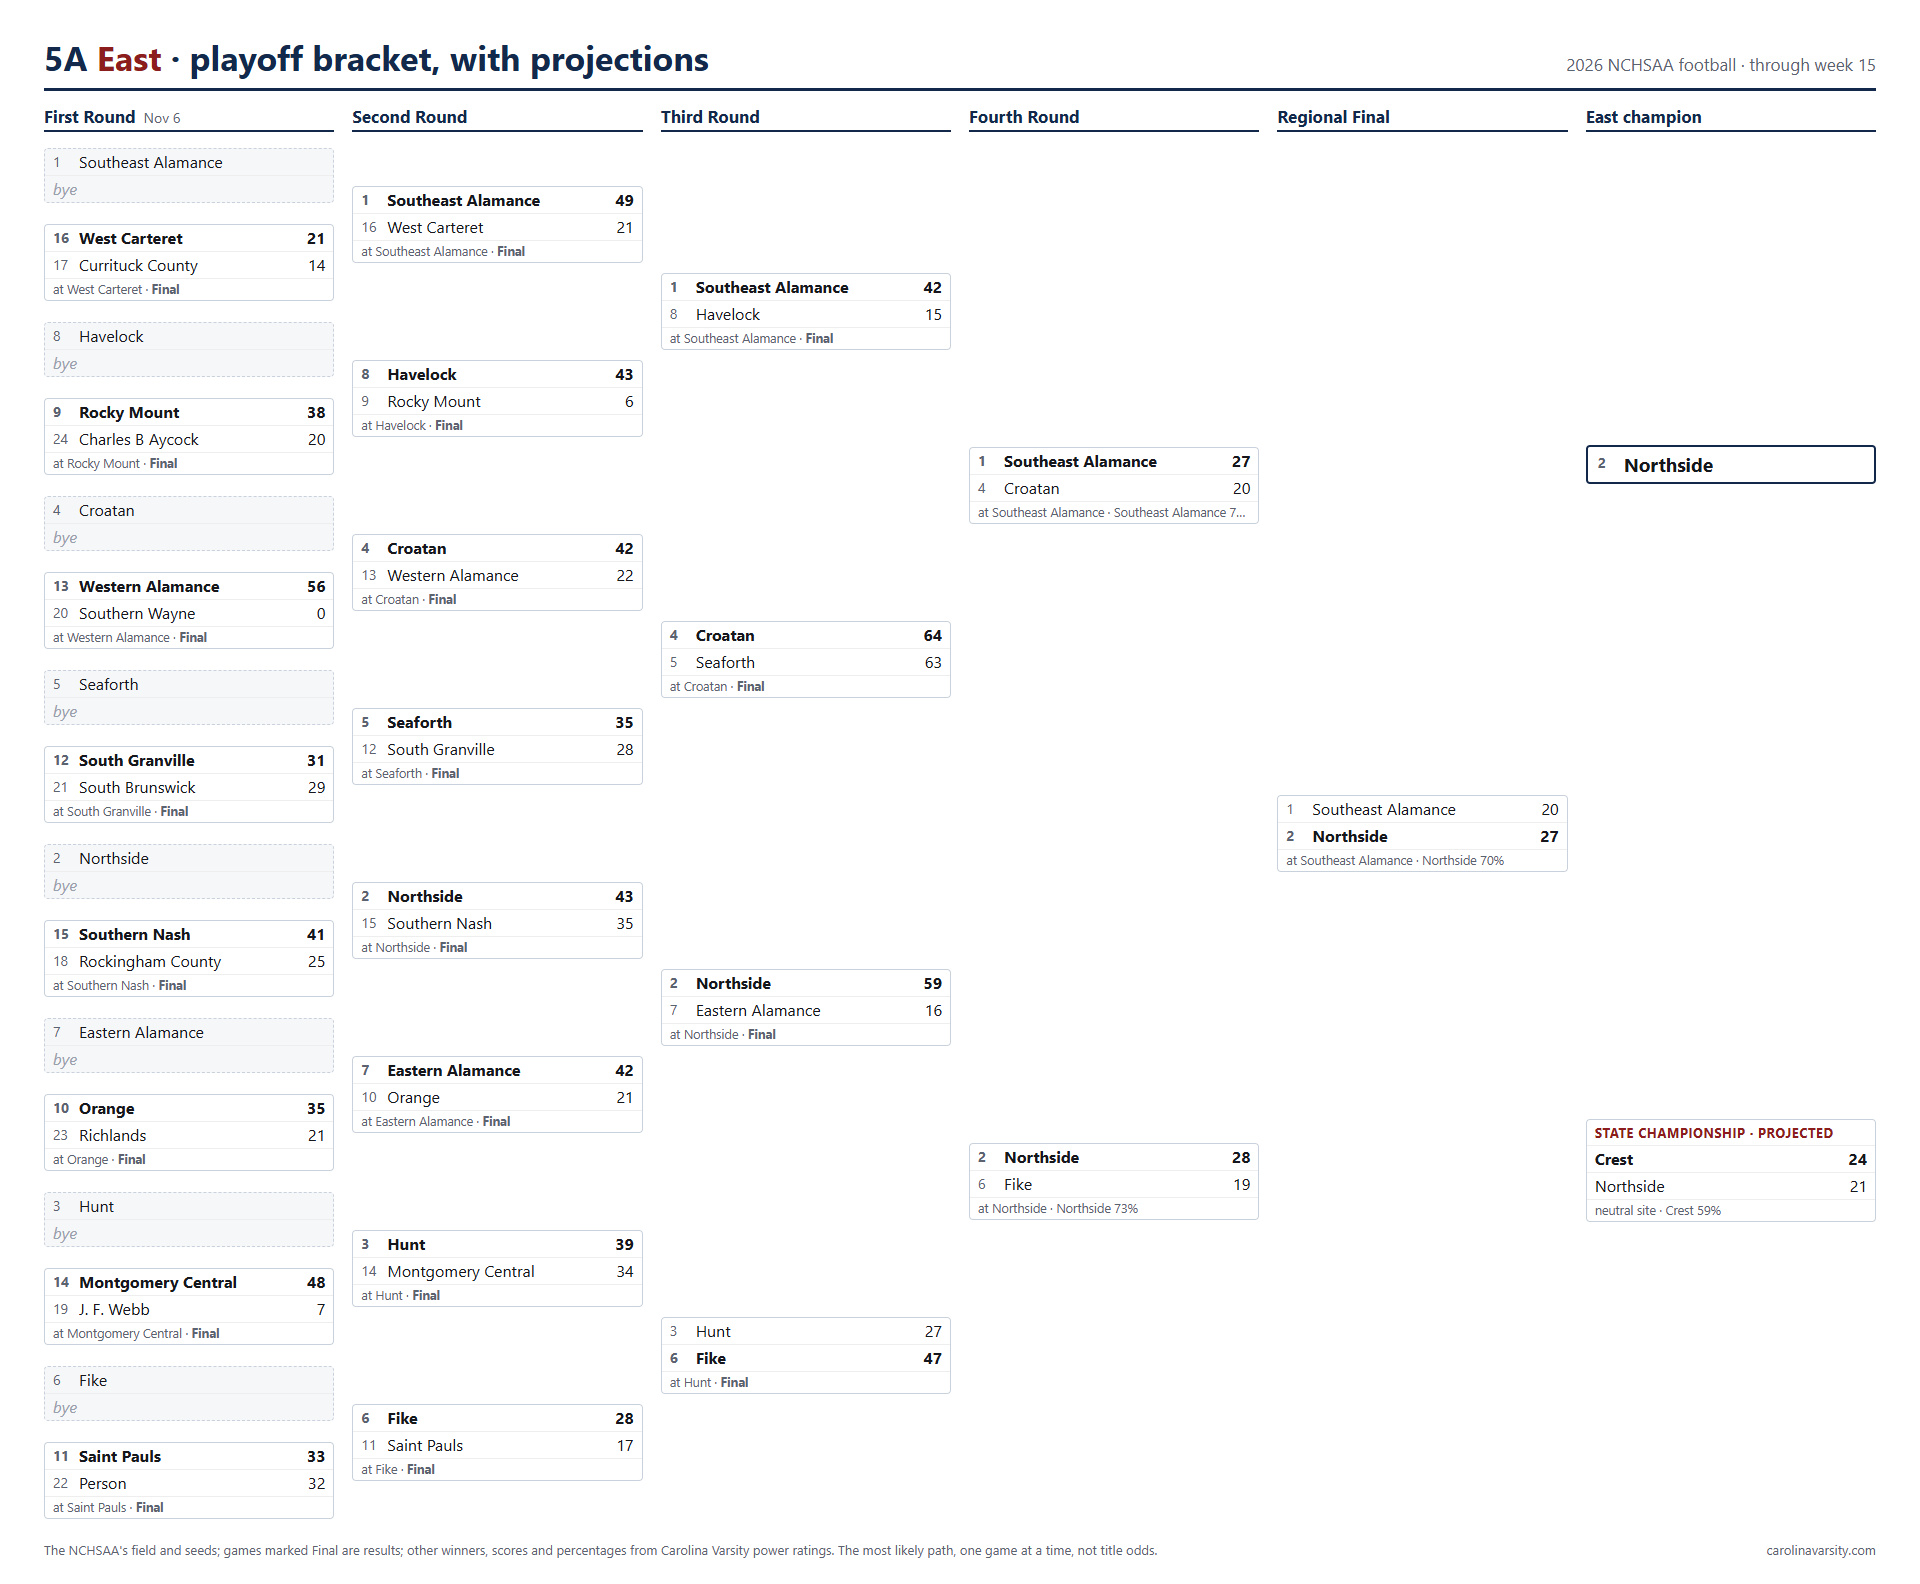
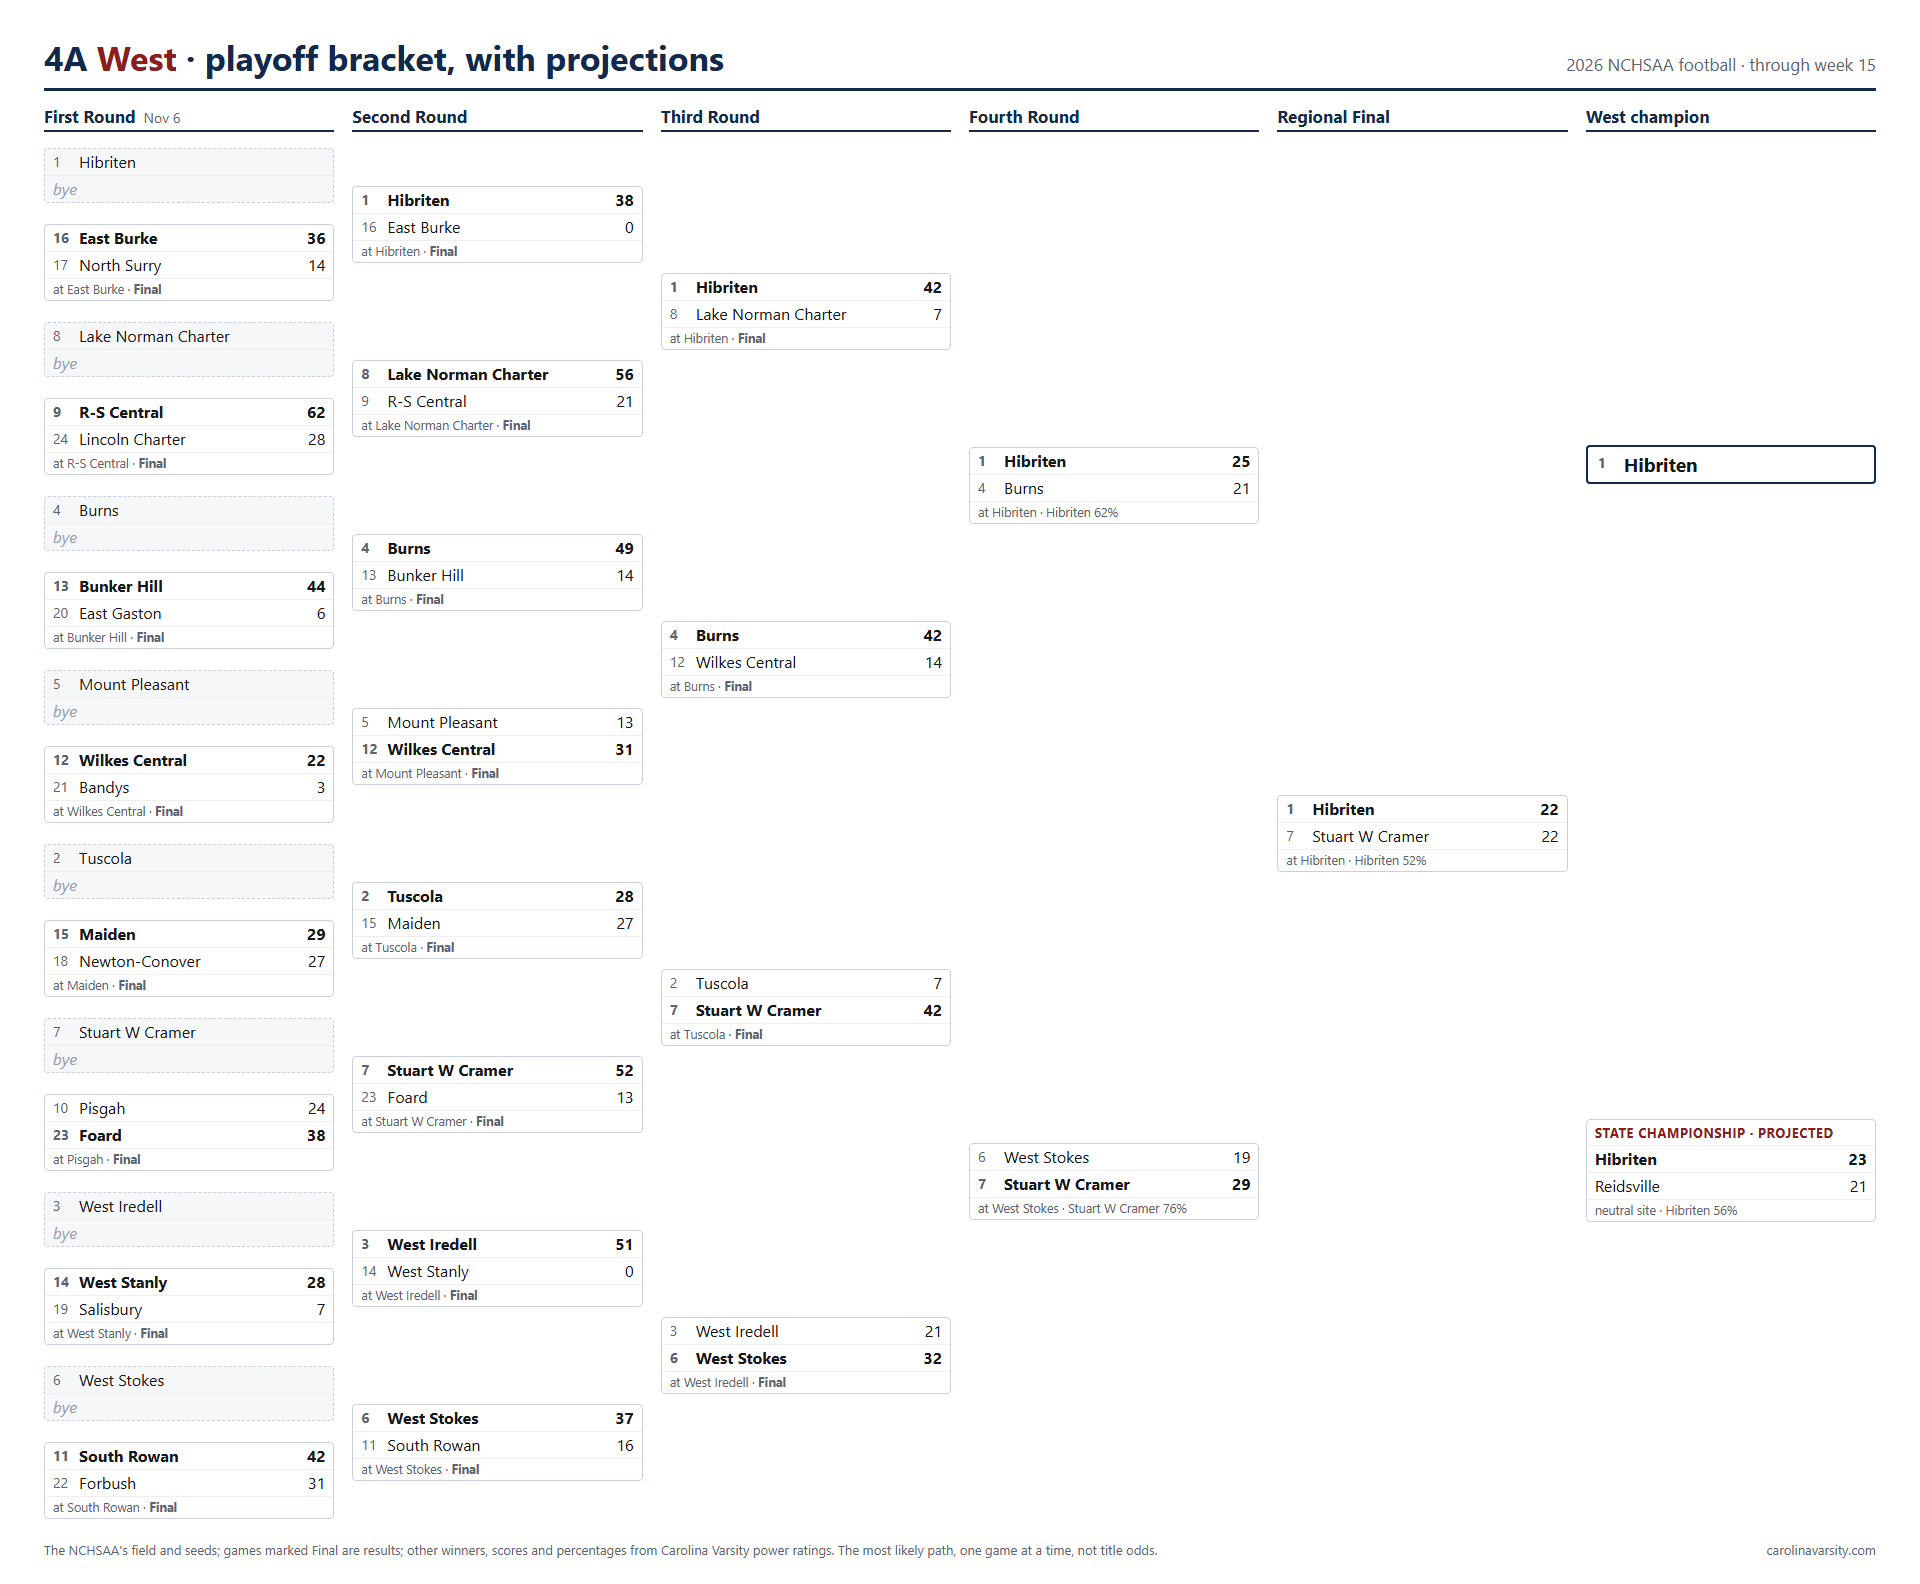
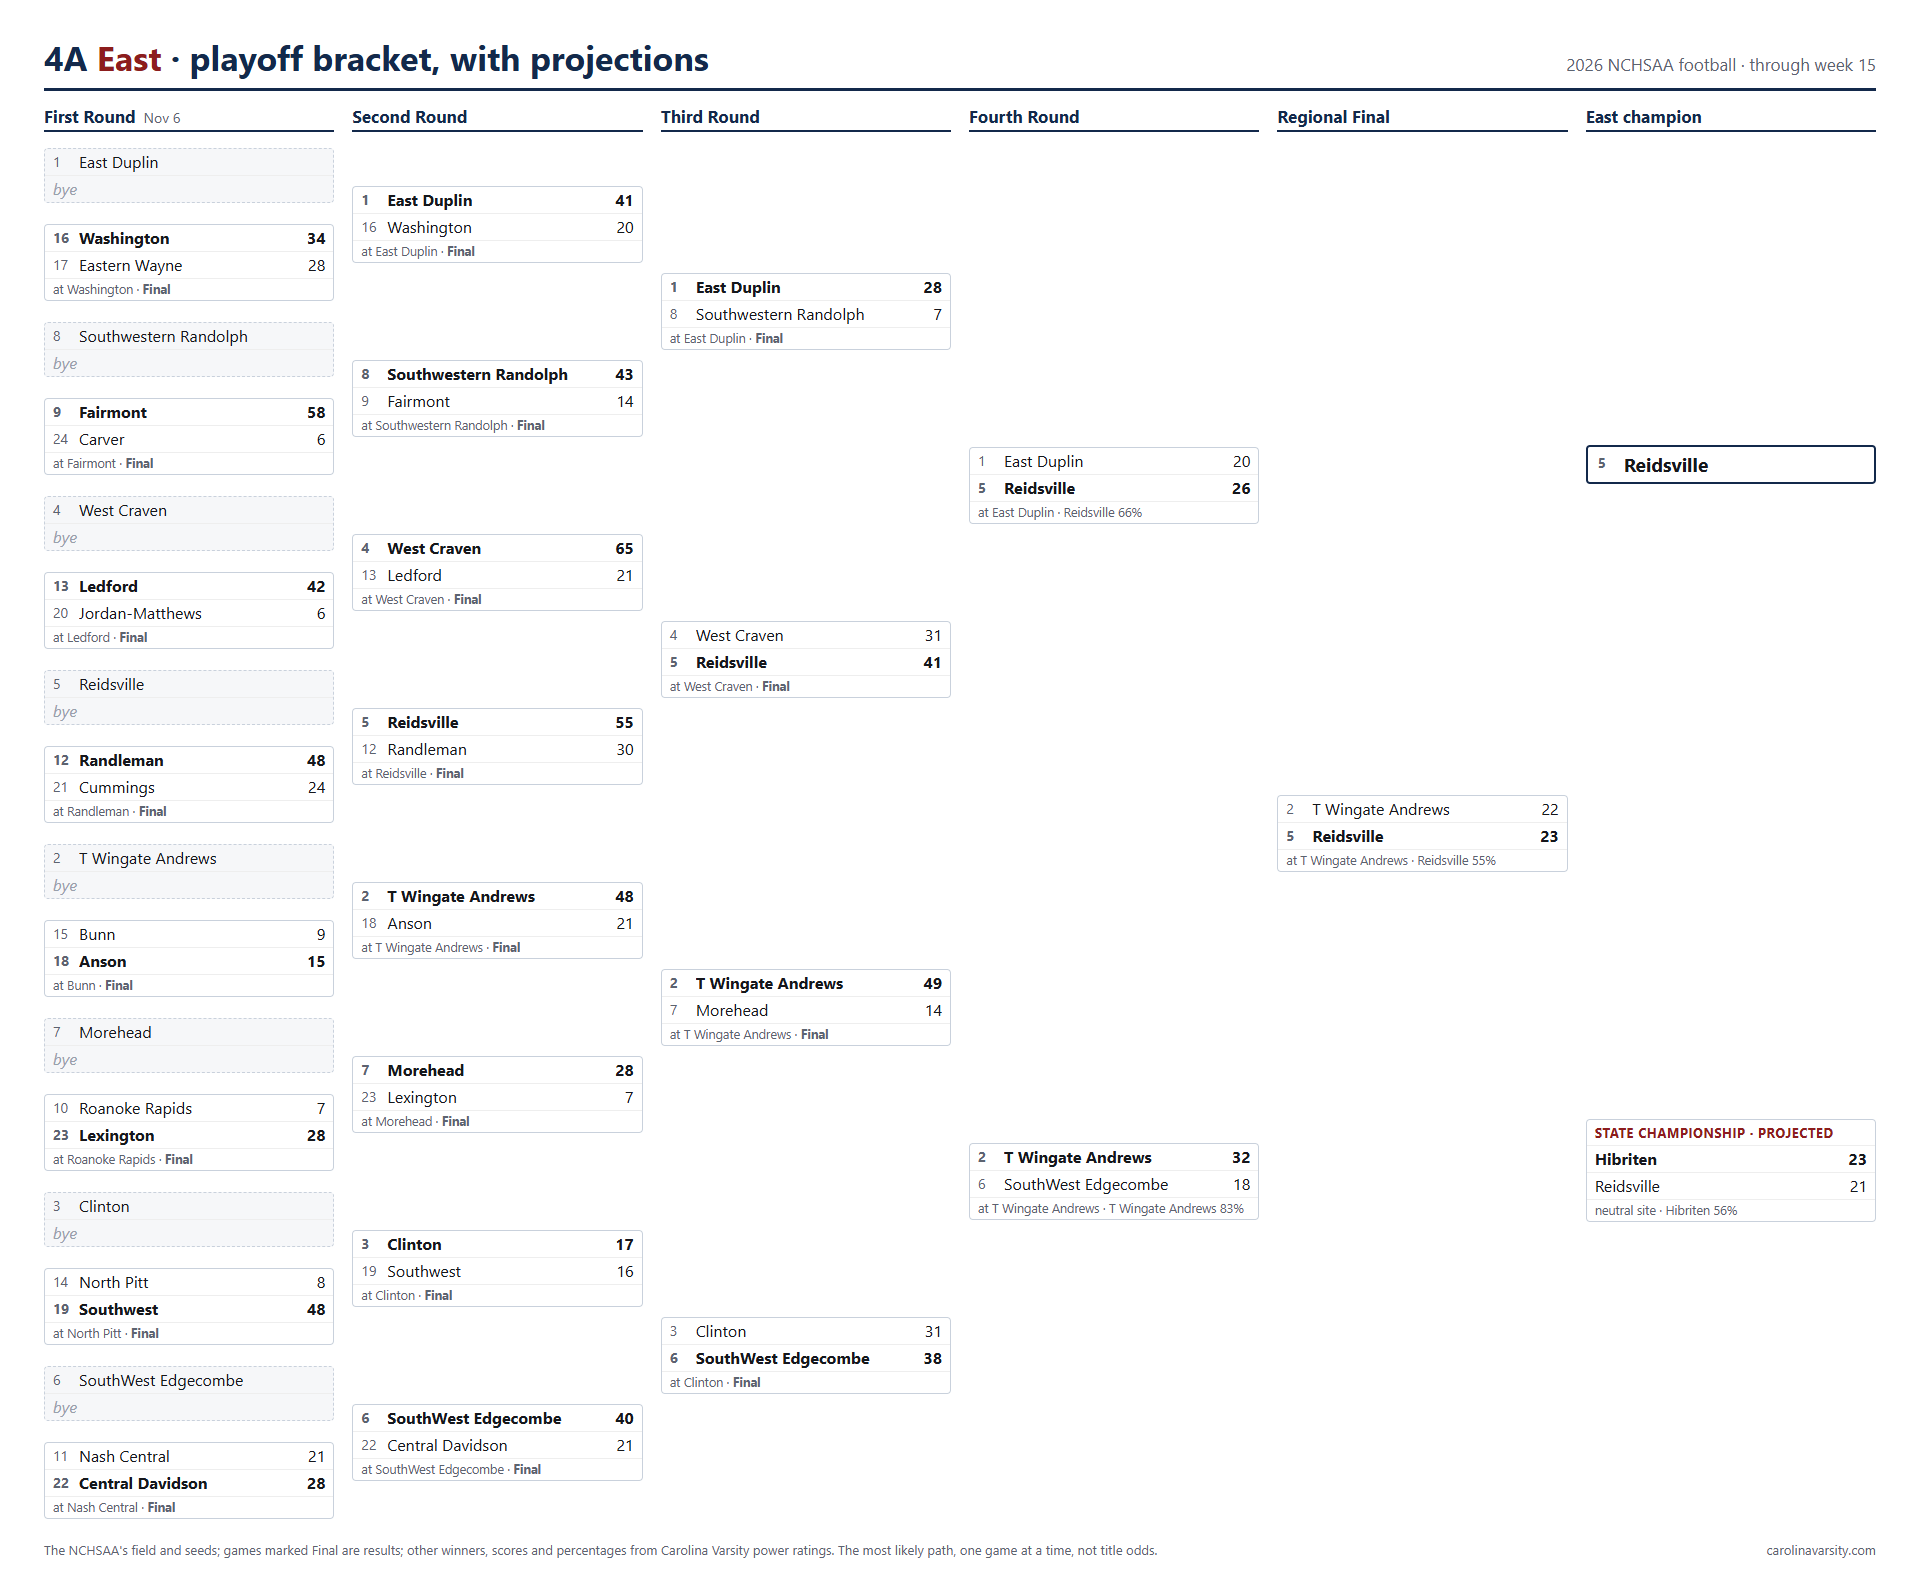
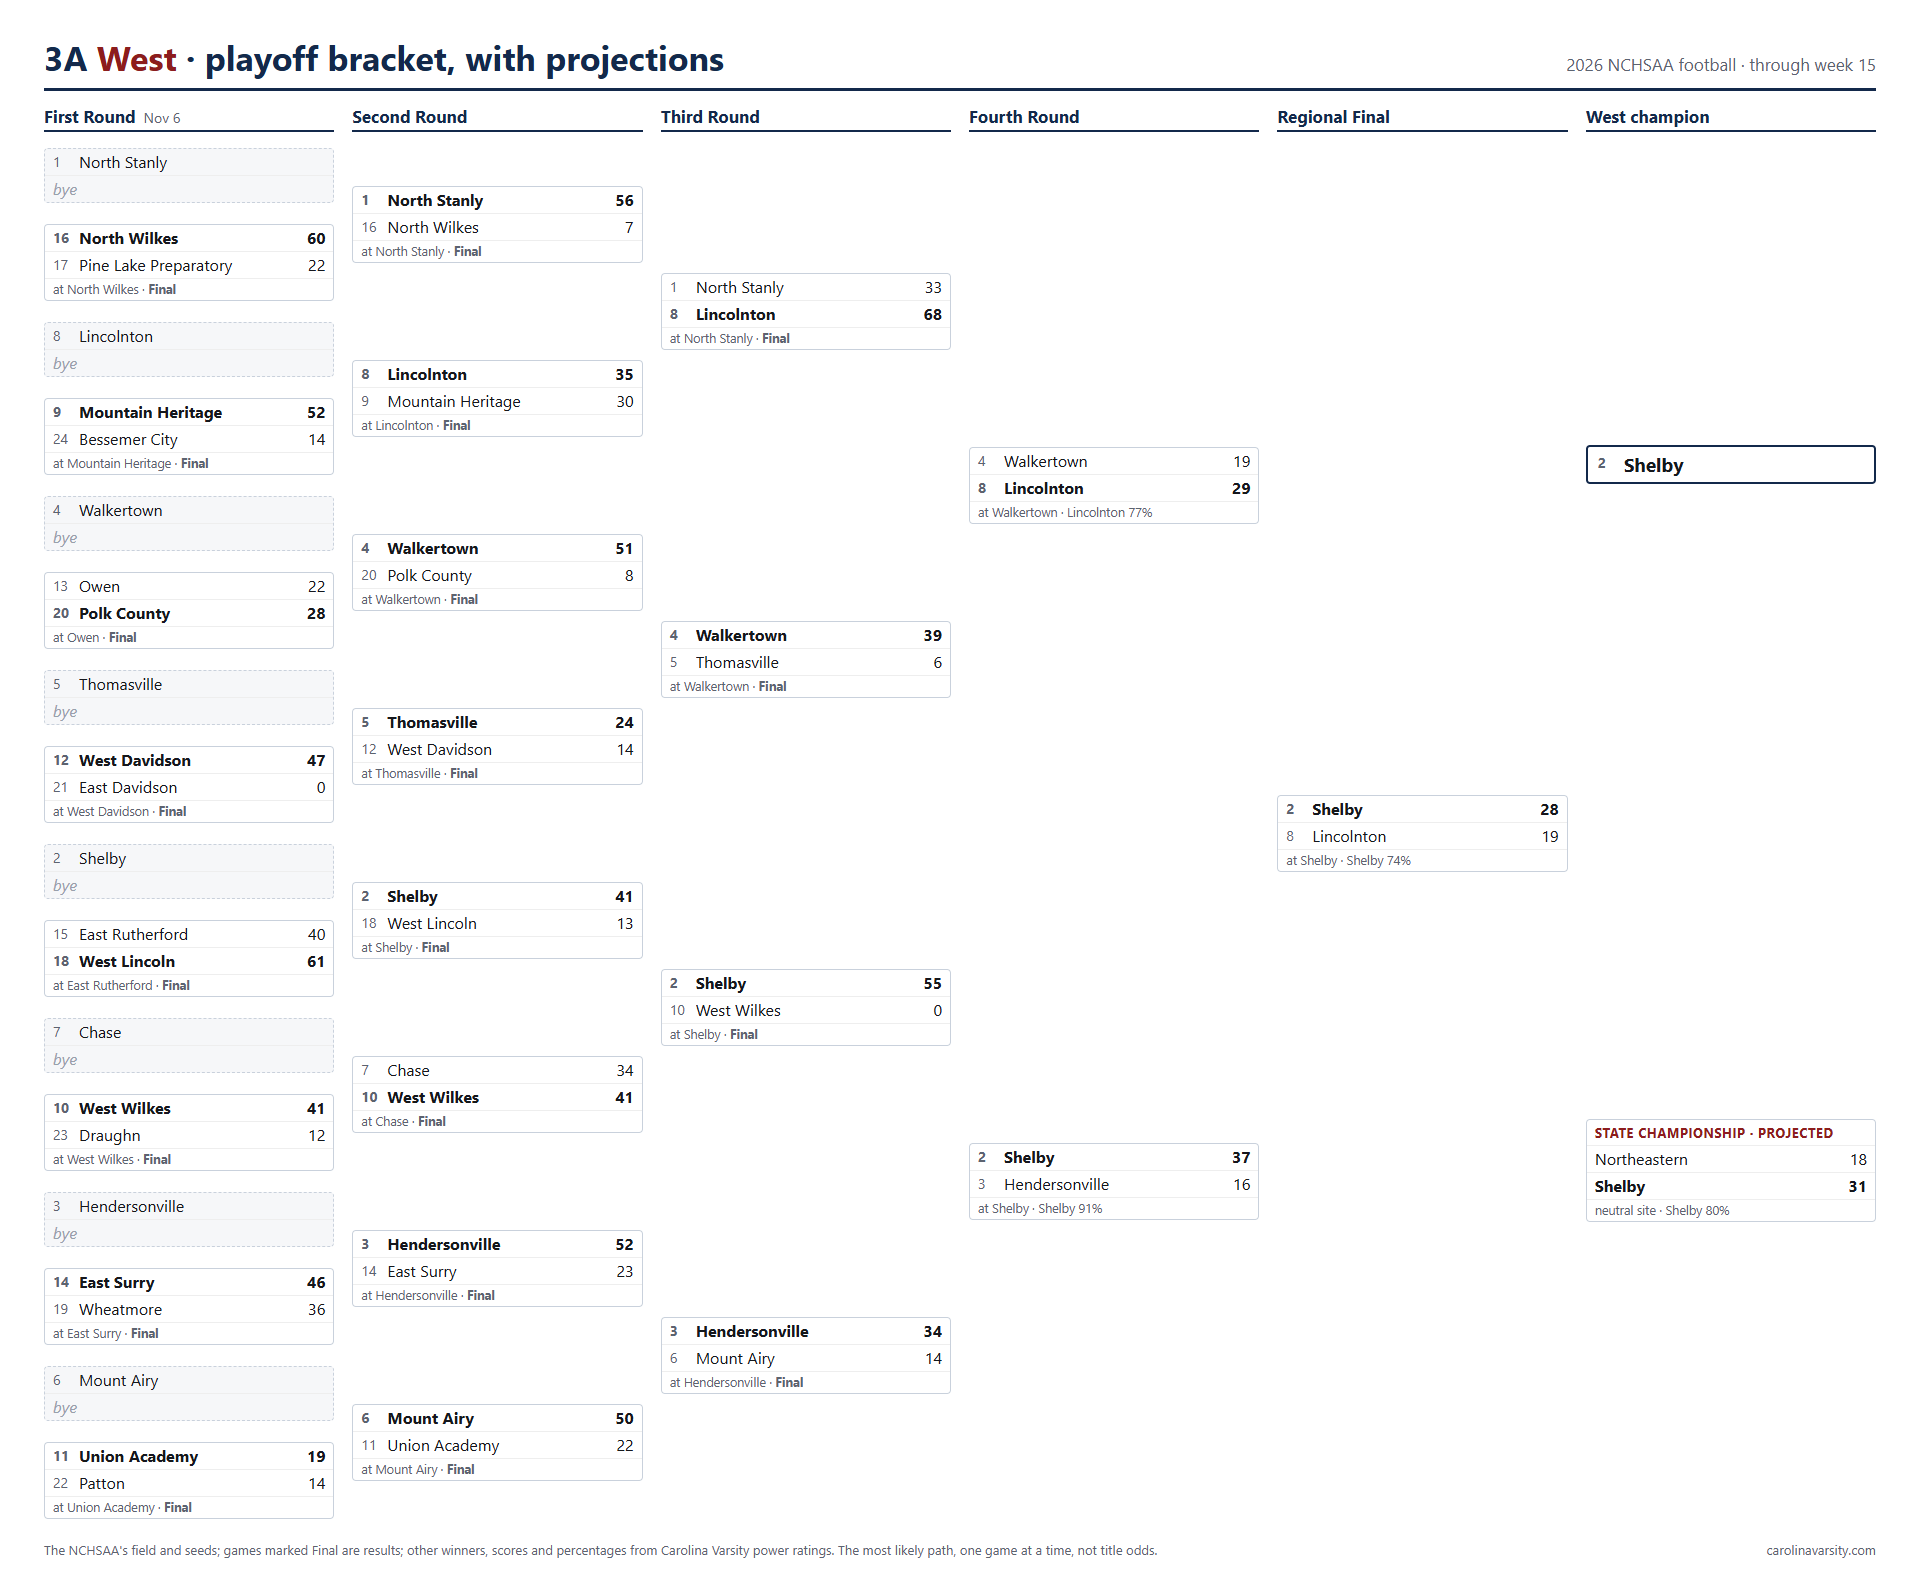
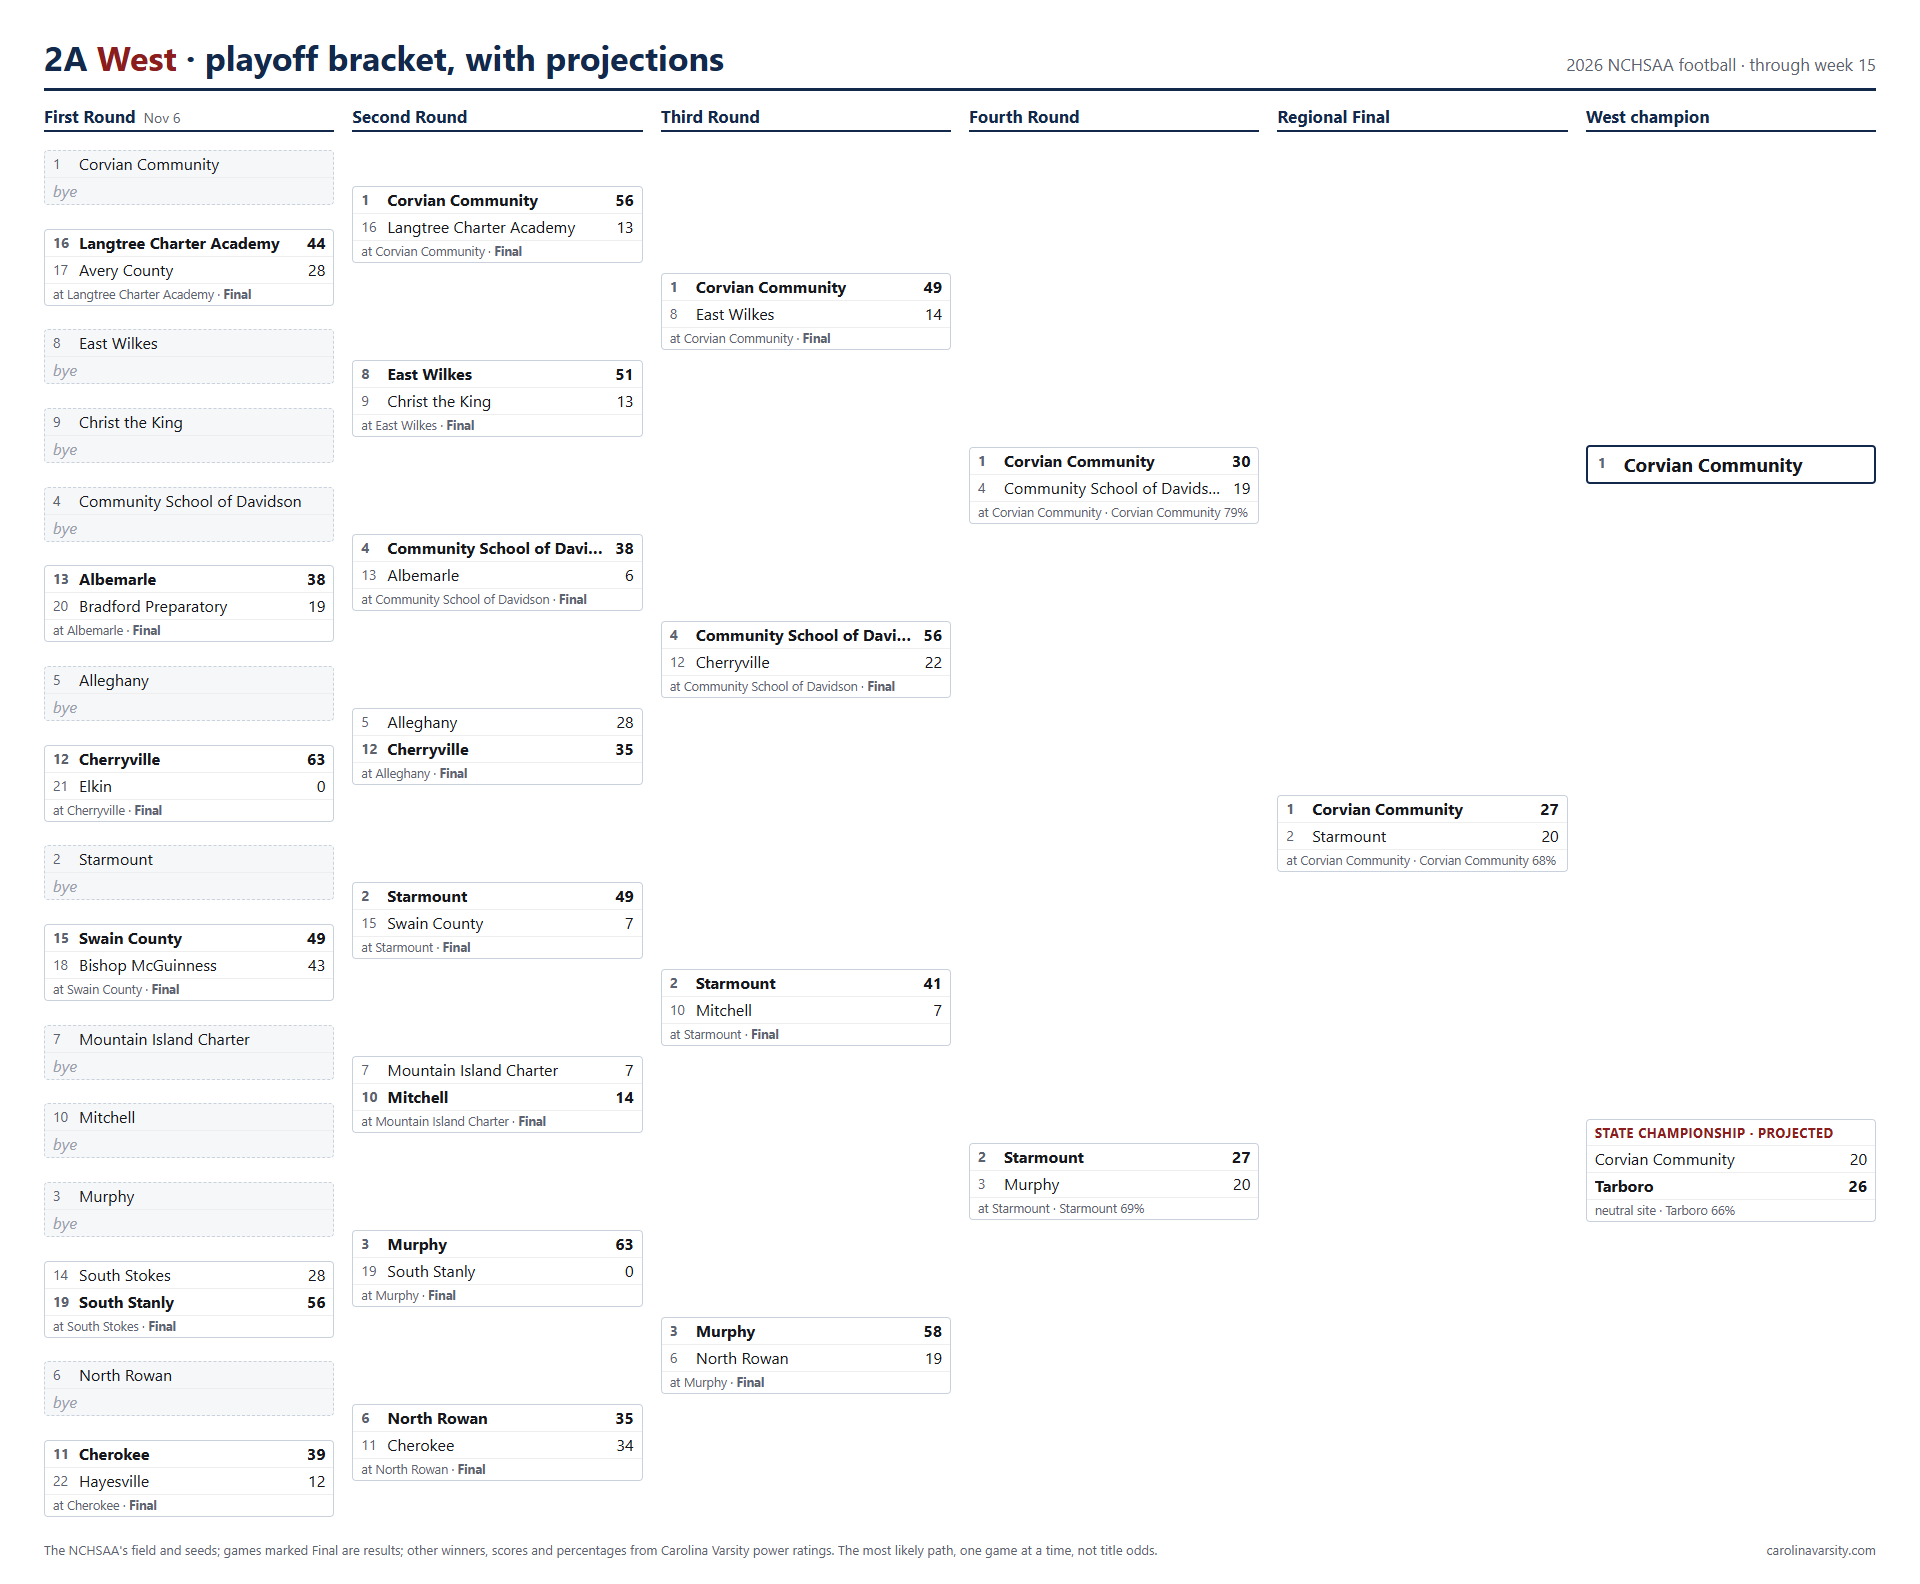
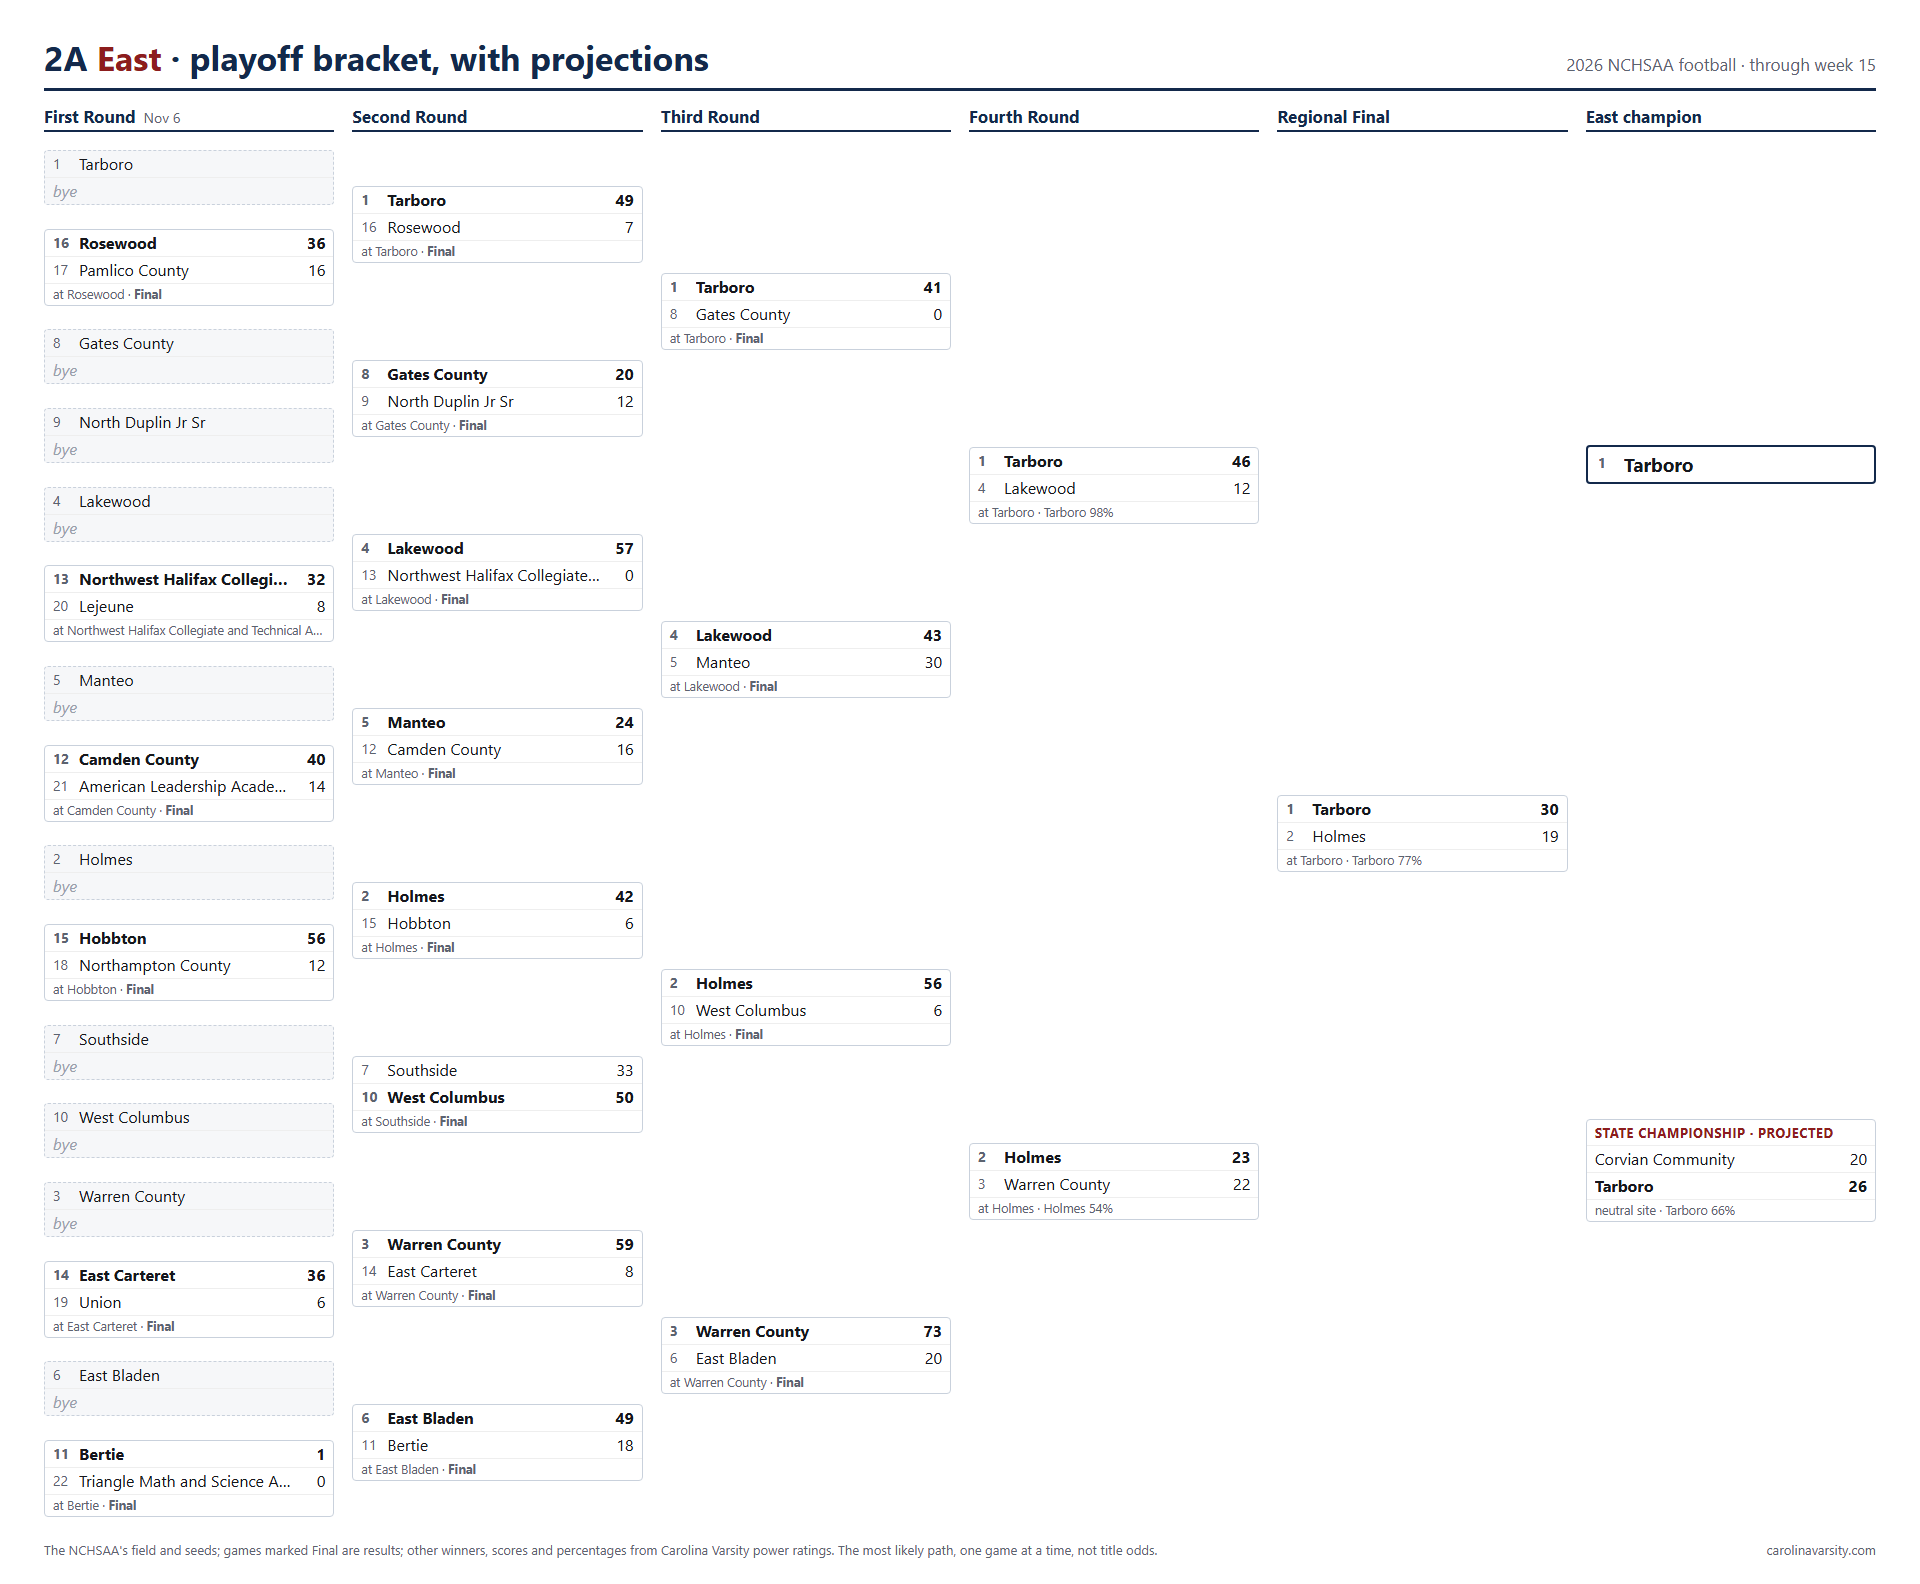
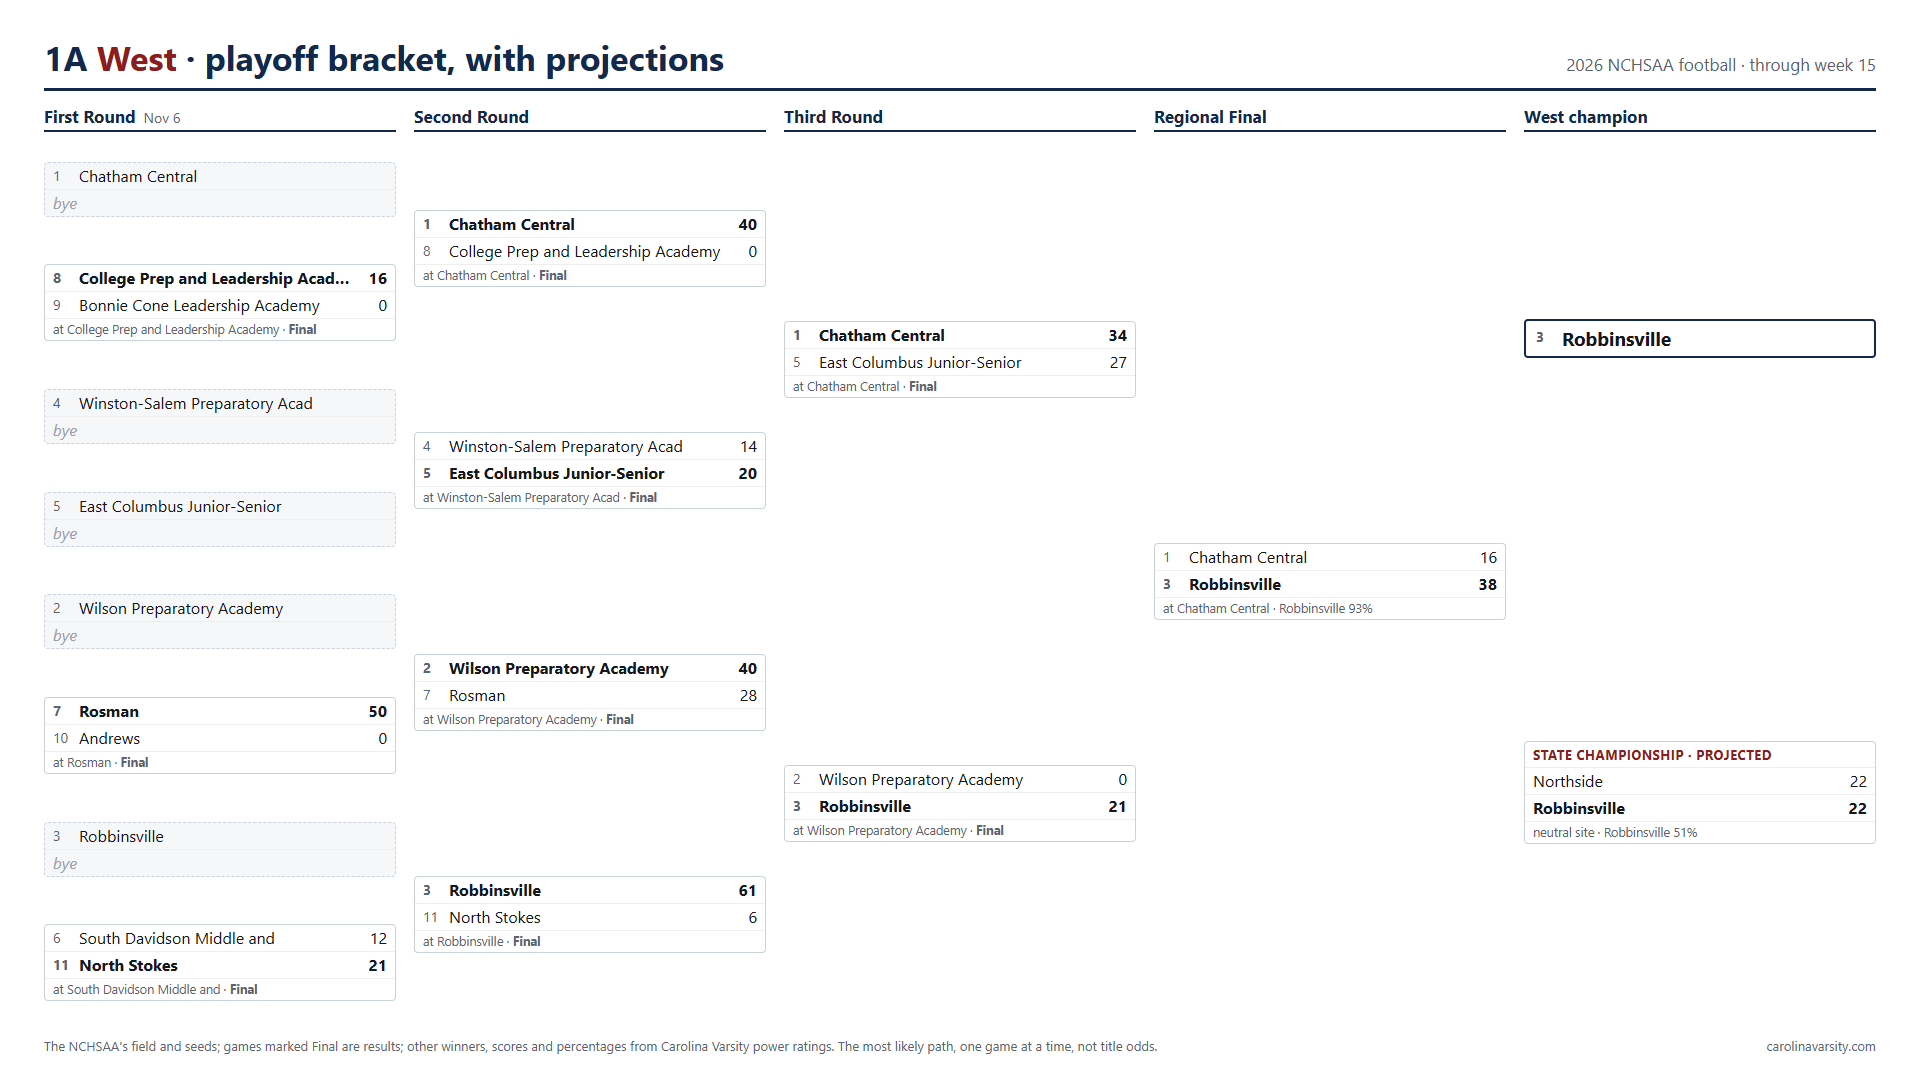
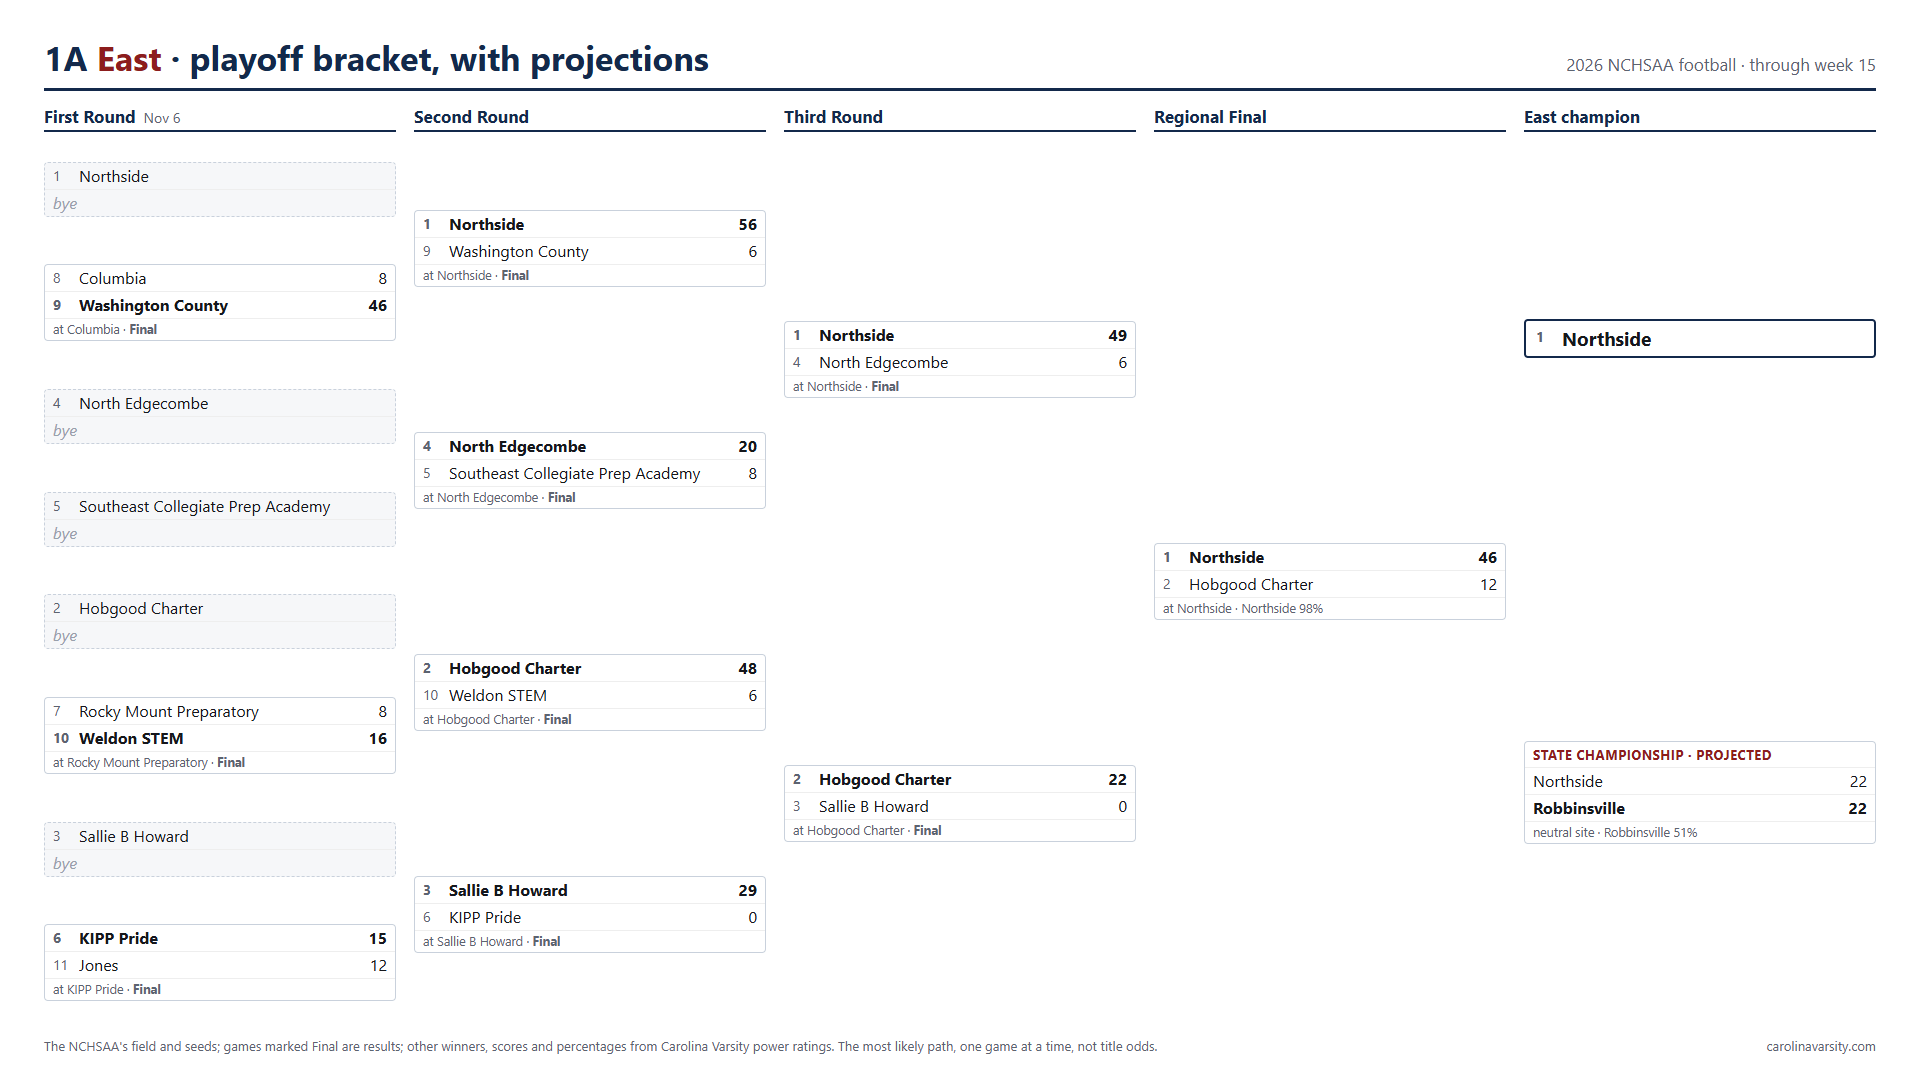
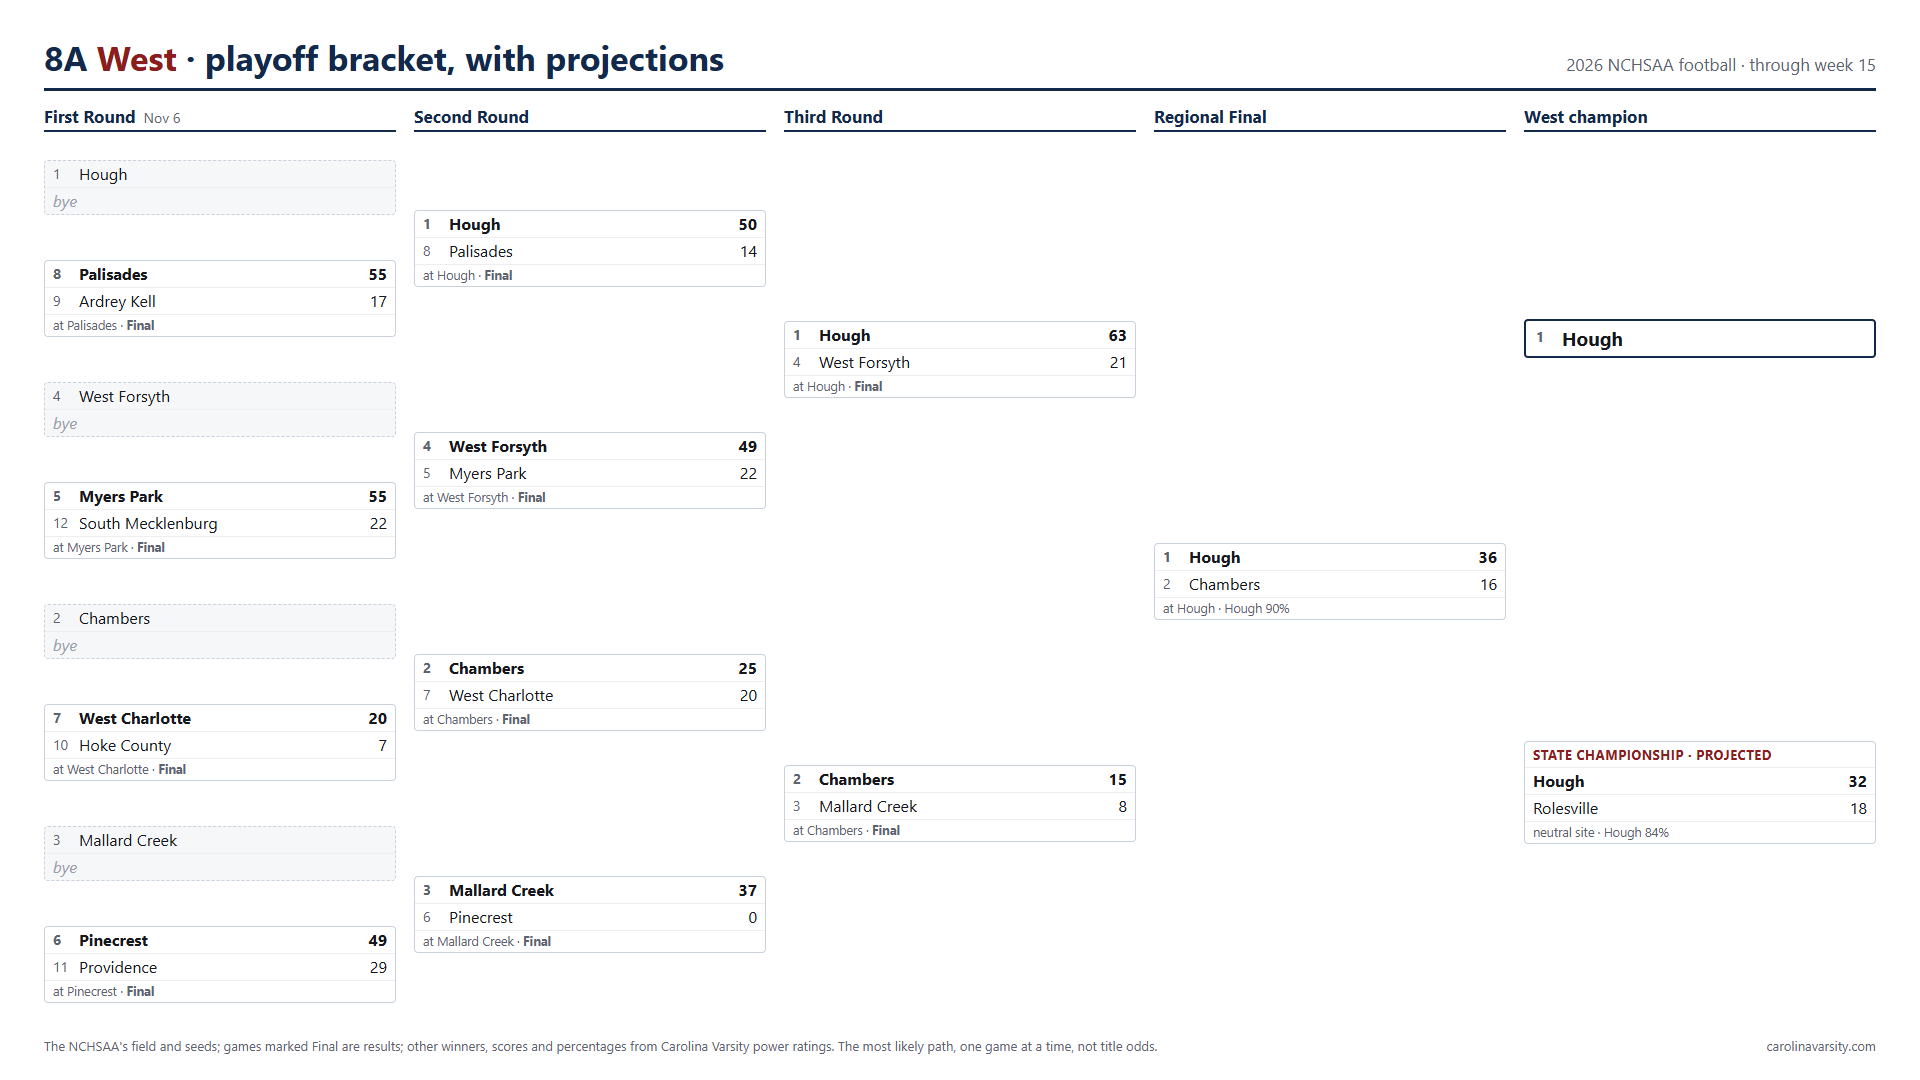
Projected champions: 8A Hough · 7A Weddington · 6A Jacksonville · 5A Crest · 4A Hibriten · 3A Shelby · 2A Tarboro · 1A Robbinsville

Playoff brackets, with projections

West and East for every classification: the NCHSAA's field and seeds, every game to the team our model favors with the score it predicts. All the brackets on one page.

8A West playoff bracket, with projections, week 15
8A West · Download the PNG
8A East playoff bracket, with projections, week 15
8A East · Download the PNG
7A West playoff bracket, with projections, week 15
7A West · Download the PNG
7A East playoff bracket, with projections, week 15
7A East · Download the PNG
6A West playoff bracket, with projections, week 15
6A West · Download the PNG
6A East playoff bracket, with projections, week 15
6A East · Download the PNG
5A West playoff bracket, with projections, week 15
5A West · Download the PNG
5A East playoff bracket, with projections, week 15
5A East · Download the PNG
4A West playoff bracket, with projections, week 15
4A West · Download the PNG
4A East playoff bracket, with projections, week 15
4A East · Download the PNG
3A West playoff bracket, with projections, week 15
3A West · Download the PNG
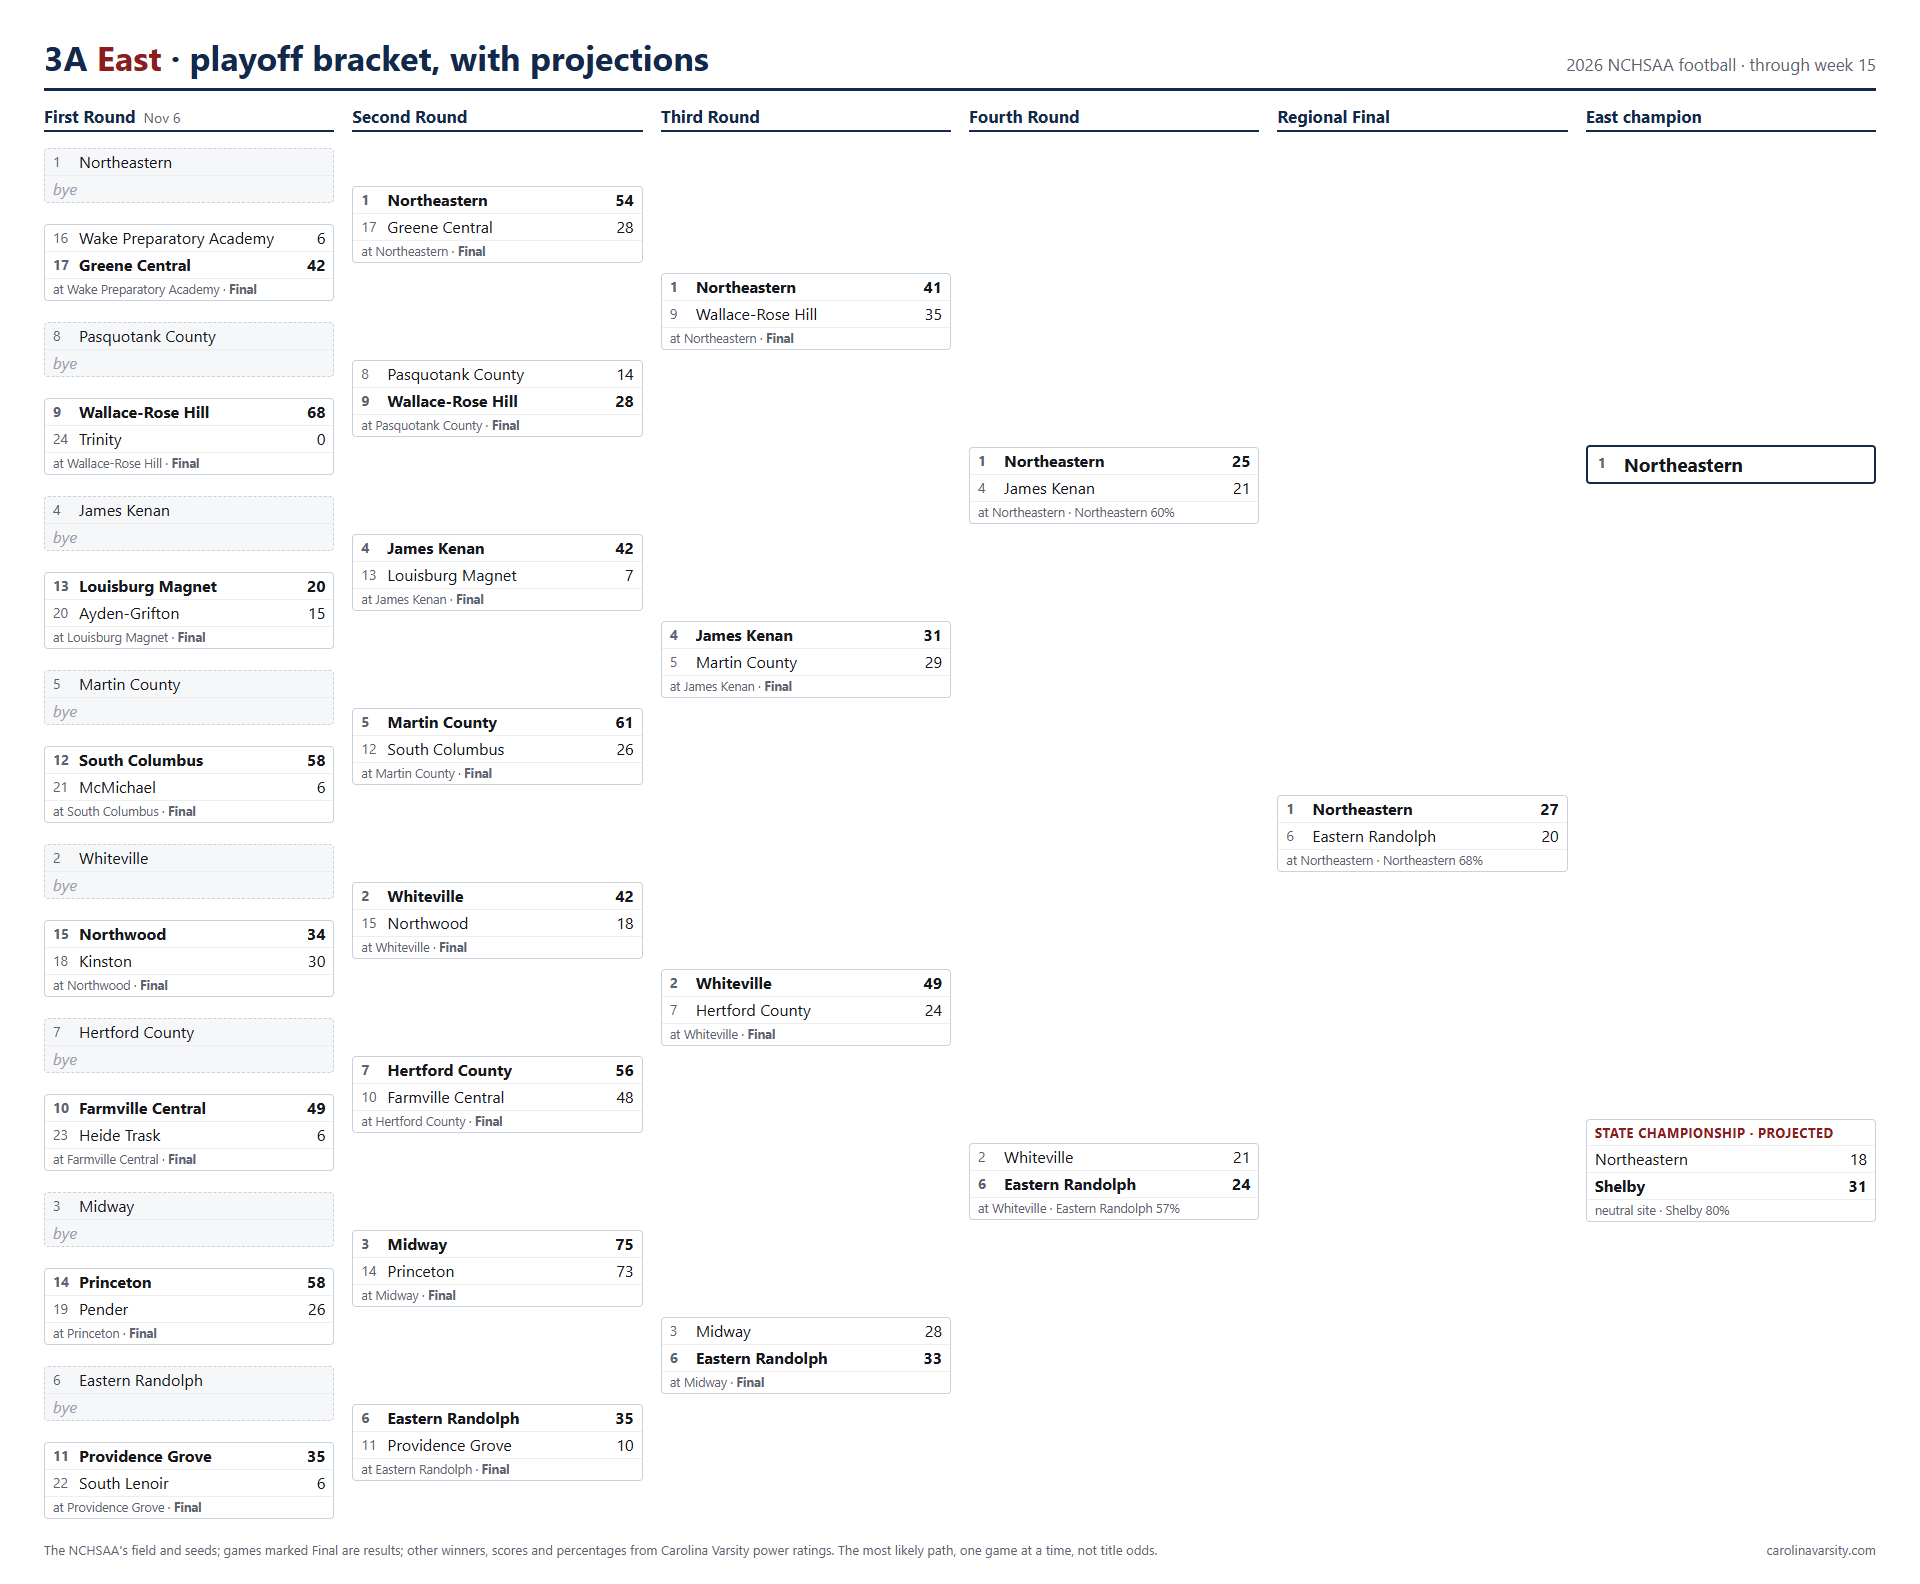
3A East playoff bracket, with projections, week 15
3A East · Download the PNG
2A West playoff bracket, with projections, week 15
2A West · Download the PNG
2A East playoff bracket, with projections, week 15
2A East · Download the PNG
1A West playoff bracket, with projections, week 15
1A West · Download the PNG
1A East playoff bracket, with projections, week 15
1A East · Download the PNG

The RPI bubble: the teams whose chance of making the playoffs is between 15% and 85%, with the last teams safely in and the first teams out on either edge, listed by that chance. In is 85% or better, Out below 15%.

8A bubble — 24 of 32 make the field
SchoolRecordPlayoff chanceStatusRPI todayRank todayProjected RPI
Edge of the bubble: last teams safely in
22Wakefield4-6-0100%In0.47898220.4596
23South Mecklenburg4-6-0100%In0.47319230.4551
24Enloe4-6-0100%In0.43711250.4292
Projected cut · top 24 make the field
Edge of the bubble: first teams out
25Willow Spring3-7-00%Out0.44869240.4286
26Northwest Guilford2-8-00%Out0.41876260.4161
27Apex3-7-00%Out0.41050270.3969

24 of 32 8A teams make the field. Teams are listed by their chance of finishing in it, from the season simulation, which plays out the games each team has left; the dashed line is where the field is projected to be cut, and the bracket is drawn from the teams above it. RPI today and Rank today are the official NCHSAA table as it stands: the top 24 would make it if the season ended now. Projected RPI is the average final RPI across the simulated seasons. The order goes by playoff chance, which also counts how far a team's finish could swing either way, so two teams close in projected RPI can sit a place or two apart.

7A bubble — 48 of 60 make the field
SchoolRecordPlayoff chanceStatusRPI todayRank todayProjected RPI
Edge of the bubble: last teams safely in
46Chapel Hill3-7-0100%In0.39384470.3840
47North Mecklenburg3-7-0100%In0.38697490.3808
48South Iredell2-8-0100%In0.39578450.3808
Projected cut · top 48 make the field
Edge of the bubble: first teams out
49Cary3-7-00%Out0.37394510.3745
50Purnell Swett3-7-00%Out0.37833500.3744
51East Wake3-7-00%Out0.39215480.3742

48 of 60 7A teams make the field. Teams are listed by their chance of finishing in it, from the season simulation, which plays out the games each team has left; the dashed line is where the field is projected to be cut, and the bracket is drawn from the teams above it. RPI today and Rank today are the official NCHSAA table as it stands: the top 48 would make it if the season ended now. Projected RPI is the average final RPI across the simulated seasons. The order goes by playoff chance, which also counts how far a team's finish could swing either way, so two teams close in projected RPI can sit a place or two apart.

6A bubble — 48 of 58 make the field
SchoolRecordPlayoff chanceStatusRPI todayRank todayProjected RPI
Edge of the bubble: last teams safely in
46South View3-7-0100%In0.41222460.4018
47Western Guilford3-7-0100%In0.40596490.3992
48Western Harnett4-6-0100%In0.41408450.3969
Projected cut · top 48 make the field
Edge of the bubble: first teams out
49Lee County2-8-00%Out0.41137480.3955
50Saint Stephens3-7-00%Out0.41200470.3932
51Southeast Guilford3-7-00%Out0.39314510.3931

48 of 58 6A teams make the field. Teams are listed by their chance of finishing in it, from the season simulation, which plays out the games each team has left; the dashed line is where the field is projected to be cut, and the bracket is drawn from the teams above it. RPI today and Rank today are the official NCHSAA table as it stands: the top 48 would make it if the season ended now. Projected RPI is the average final RPI across the simulated seasons. The order goes by playoff chance, which also counts how far a team's finish could swing either way, so two teams close in projected RPI can sit a place or two apart.

5A bubble — 48 of 57 make the field
SchoolRecordPlayoff chanceStatusRPI todayRank todayProjected RPI
Edge of the bubble: last teams safely in
46Person2-8-0100%In0.42256440.4024
47Richlands2-8-0100%In0.40205470.3956
48Charles B Aycock2-8-0100%In0.39617480.3865
Projected cut · top 48 make the field
Edge of the bubble: first teams out
49Dixon2-8-00%Out0.36431510.3704
50Northeast Guilford1-9-00%Out0.36144520.3668
51Atkins2-8-00%Out0.36572500.3569

48 of 57 5A teams make the field. Teams are listed by their chance of finishing in it, from the season simulation, which plays out the games each team has left; the dashed line is where the field is projected to be cut, and the bracket is drawn from the teams above it. RPI today and Rank today are the official NCHSAA table as it stands: the top 48 would make it if the season ended now. Projected RPI is the average final RPI across the simulated seasons. The order goes by playoff chance, which also counts how far a team's finish could swing either way, so two teams close in projected RPI can sit a place or two apart.

4A bubble — 48 of 55 make the field
SchoolRecordPlayoff chanceStatusRPI todayRank todayProjected RPI
Edge of the bubble: last teams safely in
46Lincoln Charter2-8-0100%In0.39008460.3829
47Cummings1-9-0100%In0.39790440.3783
48Carver3-7-0100%In0.37006480.3609
Projected cut · top 48 make the field
Edge of the bubble: first teams out
49Ashe County1-9-00%Out0.34647500.3428
50North Johnston2-8-00%Out0.34154510.3422
51East Henderson1-9-00%Out0.35089490.3389

48 of 55 4A teams make the field. Teams are listed by their chance of finishing in it, from the season simulation, which plays out the games each team has left; the dashed line is where the field is projected to be cut, and the bracket is drawn from the teams above it. RPI today and Rank today are the official NCHSAA table as it stands: the top 48 would make it if the season ended now. Projected RPI is the average final RPI across the simulated seasons. The order goes by playoff chance, which also counts how far a team's finish could swing either way, so two teams close in projected RPI can sit a place or two apart.

3A bubble — 48 of 52 make the field
SchoolRecordPlayoff chanceStatusRPI todayRank todayProjected RPI
Edge of the bubble: last teams safely in
46Draughn0-10-0100%In0.32614470.3198
47Patton1-9-0100%In0.32667460.3186
48Trinity1-9-0100%In0.30719500.2990
Projected cut · top 48 make the field
Edge of the bubble: first teams out
49Goldsboro0-10-00%Out0.29021520.2911
50Bartlett Yancey1-9-00%Out0.29315510.2897
51Beddingfield0-10-00%Out0.26539530.2597

48 of 52 3A teams make the field. Teams are listed by their chance of finishing in it, from the season simulation, which plays out the games each team has left; the dashed line is where the field is projected to be cut, and the bracket is drawn from the teams above it. RPI today and Rank today are the official NCHSAA table as it stands: the top 48 would make it if the season ended now. Projected RPI is the average final RPI across the simulated seasons. The order goes by playoff chance, which also counts how far a team's finish could swing either way, so two teams close in projected RPI can sit a place or two apart.

2A bubble — 48 of 44 make the field

All 44 2A teams make the 48-team field, so there is no bubble in 2A.

1A bubble — 48 of 22 make the field

All 22 1A teams make the 48-team field, so there is no bubble in 1A.

Winningest Coaches

North Carolina head-coaching records: every game in our archive for the seasons a coach is credited with, from HSFHA, the NCHSAA, NCHSFootball and MaxPreps, with a published stint filling a season no source names. Records outside North Carolina are HSFHA's. Still being completed: for 1980-1999 many seasons have no coach on record anywhere yet.

All-time, by NC wins

CoachSchoolsNC recordPctSeasonsState titlesOther statesCareer
1Jack HolleyTabor City 1964-69, 1972-81; Hallsboro 1970-71; Wallace-Rose Hill 1982-92, 1997-2008; South Columbus 1993-96; Harrells Christian Academy 2009-10417-126-8.76447417-126-8
2David GentryEdneyville 1974-83; Murphy 1984-2020406-173-2.701479406-173-2
3Burton CatesEastern Randolph 1984-2009, 2012, 2018-26; Lee County 2010-11, 2013-14, 2016-17395-132.750421395-132
4Bob ParoliBenson 1958-63; Jacksonville 1964; Fike 1971-75; Cummings 1976-79; Douglas Byrd 1980-2004; Seventy-First 2005-12375-191-11.659491375-191-11
5Jim TeagueEastern Alamance 1985-88; Garinger 1989-91; Reidsville 1992-2008, 2012-22371-102.784358371-102
6Tom BrownMaiden 1966-78, 1986-2004, 2006-07; Bunker Hill 1982-85; East Burke 2014-16354-139-7.715412354-139-7
7Jim OddoCharlotte Catholic 1973-2008, 2010-13350-142-2.711403350-142-2
8Bob LewisEast Bladen 1972-79; Pender 1980-85; Clinton 1988-2001, 2004, 2012-17; Harrells Christian Academy 2007; Whiteville 2008-09; South Brunswick 2020316-142-6.688394316-142-6
9Allen BrownCentral Davidson 1968; Thomasville 1973-99, 2008, 2010-13311-103-2.750334311-103-2
10Tom KnottsHarding University 1983-88; West Charlotte 1989-99; Independence 2000-03, 2005-09306-45.872267195-29-1 (SC)501-74-1

Rank all coaches →

Coaching in 2026, by NC wins

CoachSchoolsNC recordPctSeasonsState titlesOther statesCareer
1Burton CatesEastern Randolph 1984-2009, 2012, 2018-26; Lee County 2010-11, 2013-14, 2016-17395-132.750421395-132
2Jeff CraddockTarboro 2004-26267-48.848239267-48
3Steve DavisDudley 2004-26253-62.803235253-62
4Richard BaileyJack Britt 2000-02, 2004, 2006-10; Scotland 2012-26243-76.76224243-76
5Antonio MooreNortheastern 2005-26240-58.80522240-58
6Donnie KieferSaint Pauls 1986-87; Southwest Guilford 1988-90; Gates County 1991-93; Andrews 1994-95; Hibriten 1996-98; Roanoke 1999-2003; East Carteret 2004-06; Tuscola 2007-11; Central Cabarrus 2012-16, 2022, 2025-26234-175-5.5713455-34 (SC)289-209-5
7John KirbyEastern Alamance 2001-02, 2004-23, 2025-26224-86-1.72224224-86-1
8Todd WillertEast Forsyth 2003-26213-88.708242213-88
9Greg LloydKings Mountain 2004, 2007-22; East Gaston 2005-06; Starmount 2023; Crest 2024-26203-96.679231203-96
10Darryl BrownSouthern Guilford 2004, 2006-15; Grimsley 2016-19, 2021-26202-71.740212202-71

Rank all active coaches →

Season Projection

120 simulated seasons. Results through week 14 are taken as they stand; every week after that is played out in full, with ratings refit after each one. Outcomes are sampled rather than awarded to the favorite, so upsets happen at the rate the model believes they happen. The mean rating comes back close to where the season has already put each team — a simulation learns nothing new about games nobody has played — so the 10th–90th band, not the mean, is the forecast, and it widens the further out the projection runs.

Projected final power rankings — top 25

SchoolClassProj. recordRating10th–90thSOSUnbeaten
1Hough8A12.0-0.063.863.8 – 63.827.4100%
2Grimsley7A12.0-0.056.856.7 – 56.819.5100%
3Weddington7A12.0-0.056.456.4 – 56.422.5100%
4Millbrook8A10.0-1.056.056.0 – 56.026.2—
5Providence DayNCISAA I12.0-1.053.753.6 – 53.828.0—
6Rolesville8A9.0-2.053.253.2 – 53.327.9—
7Lake Norman7A12.0-0.053.253.1 – 53.218.0100%
8Junius H Rose6A11.0-1.049.749.6 – 49.724.6—
9Cleveland7A11.0-1.048.548.5 – 48.525.3—
10Reagan7A10.0-2.048.248.2 – 48.225.7—
11Hoggard8A11.0-1.048.148.1 – 48.120.1—
12Cardinal Gibbons7A9.0-3.047.847.8 – 47.929.0—
13Northern Nash6A10.0-2.047.647.5 – 47.617.6—
14Chambers8A11.0-1.047.447.4 – 47.525.0—
15Jacksonville6A9.0-2.046.946.9 – 47.019.4—
16Mallard Creek8A9.0-3.046.346.3 – 46.433.3—
17West Forsyth8A9.0-3.045.445.4 – 45.428.3—
18Clayton7A10.0-2.045.245.2 – 45.321.9—
19Garner7A9.0-3.045.245.2 – 45.229.4—
20Middle Creek6A10.0-2.043.843.8 – 43.924.7—
21Southern School of Energy and Sustainability7A11.0-1.043.343.2 – 43.38.4—
22Southeast Raleigh7A8.0-4.041.641.5 – 41.624.1—
23East Forsyth7A8.0-4.041.041.0 – 41.027.1—
24Wake Forest7A9.0-3.040.940.8 – 40.917.4—
25Northside5A12.0-0.040.640.6 – 40.614.3100%

Rank all teams →

By classification

8A — projected top 10
SchoolProj. recordRating10th–90thSOSUnbeaten
1Hough12.0-0.063.863.8 – 63.827.4100%
2Millbrook10.0-1.056.056.0 – 56.026.2—
3Rolesville9.0-2.053.253.2 – 53.327.9—
4Hoggard11.0-1.048.148.1 – 48.120.1—
5Chambers11.0-1.047.447.4 – 47.525.0—
6Mallard Creek9.0-3.046.346.3 – 46.433.3—
7West Forsyth9.0-3.045.445.4 – 45.428.3—
8Palisades9.0-3.034.134.1 – 34.218.3—
9Myers Park8.0-4.033.333.2 – 33.325.4—
10Pinecrest8.0-4.030.730.7 – 30.724.9—

Rank all 8A teams →

NCISAA I — projected top 9
SchoolProj. recordRating10th–90thSOSUnbeaten
1Providence Day12.0-1.053.753.6 – 53.828.0—
2Cannon [Cannon/Concord Academy]8.0-4.027.127.0 – 27.320.0—
3Christ School7.0-4.022.822.5 – 23.016.3—
4Charlotte Country Day School3.0-8.015.915.8 – 16.022.9—
5Charlotte Latin5.0-6.014.214.1 – 14.322.2—
6Charlotte Christian3.0-7.08.78.6 – 8.817.6—
7Metrolina Christian Academy4.0-7.05.04.7 – 5.210.7—
8North Raleigh Christian Academy7.0-3.04.34.0 – 4.6-2.8—
9Ravenscroft2.0-8.0-12.4-12.7 – -12.1-0.5—

Rank all NCISAA I teams →

7A — projected top 10
SchoolProj. recordRating10th–90thSOSUnbeaten
1Grimsley12.0-0.056.856.7 – 56.819.5100%
2Weddington12.0-0.056.456.4 – 56.422.5100%
3Lake Norman12.0-0.053.253.1 – 53.218.0100%
4Cleveland11.0-1.048.548.5 – 48.525.3—
5Reagan10.0-2.048.248.2 – 48.225.7—
6Cardinal Gibbons9.0-3.047.847.8 – 47.929.0—
7Clayton10.0-2.045.245.2 – 45.321.9—
8Garner9.0-3.045.245.2 – 45.229.4—
9Southern School of Energy and Sustainability11.0-1.043.343.2 – 43.38.4—
10Southeast Raleigh8.0-4.041.641.5 – 41.624.1—

Rank all 7A teams →

6A — projected top 10
SchoolProj. recordRating10th–90thSOSUnbeaten
1Junius H Rose11.0-1.049.749.6 – 49.724.6—
2Northern Nash10.0-2.047.647.5 – 47.617.6—
3Jacksonville9.0-2.046.946.9 – 47.019.4—
4Middle Creek10.0-2.043.843.8 – 43.924.7—
5Scotland11.0-1.039.939.9 – 39.914.5—
6Kings Mountain9.0-3.036.836.8 – 36.914.5—
7Roberson10.0-2.036.536.5 – 36.59.9—
8Seventy-First10.0-2.034.734.7 – 34.710.2—
9Union Pines10.0-2.030.030.0 – 30.07.7—
10Asheville11.0-1.029.629.6 – 29.712.8—

Rank all 6A teams →

5A — projected top 10
SchoolProj. recordRating10th–90thSOSUnbeaten
1Northside12.0-0.040.640.6 – 40.614.3100%
2Jay M Robinson12.0-0.040.240.2 – 40.23.7100%
3Crest11.0-1.040.039.9 – 40.021.0—
4Oak Grove9.0-3.039.639.6 – 39.613.4—
5South Point11.0-1.037.837.8 – 37.817.5—
6Monroe9.0-3.036.236.2 – 36.214.8—
7Hickory8.0-4.036.236.2 – 36.214.8—
8East Lincoln11.0-1.034.534.5 – 34.511.9—
9Southeast Alamance12.0-0.033.032.9 – 33.09.9100%
10Fike10.0-2.032.532.5 – 32.56.2—

Rank all 5A teams →

NCISAA II — projected top 9
SchoolProj. recordRating10th–90thSOSUnbeaten
1Asheville School (Independent)9.0-3.029.529.2 – 29.710.8—
2High Point Christian Academy9.0-3.020.119.8 – 20.50.2—
3Trinity Christian8.0-5.012.512.1 – 12.84.0—
4Harrells Christian Academy6.0-6.01.3-0.7 – 3.33.3—
5SouthLake Christian Academy6.0-6.0-3.0-3.6 – -2.4-2.3—
6Wayne Christian6.0-4.0-10.0-10.4 – -9.7-17.9—
7Hickory Grove Christian7.0-4.0-13.3-13.6 – -13.1-15.4—
8Covenant Day1.2-8.8-14.5-15.4 – -13.42.5—
9GRACE Christian4.0-6.0-26.7-27.2 – -26.2-18.1—

Rank all NCISAA II teams →

4A — projected top 10
SchoolProj. recordRating10th–90thSOSUnbeaten
1Stuart W Cramer10.0-2.029.129.0 – 29.1-3.7—
2Hibriten12.0-0.027.327.2 – 27.3-8.8100%
3Reidsville9.0-3.025.825.8 – 25.92.0—
4West Iredell10.0-2.025.425.4 – 25.55.8—
5Burns9.0-3.025.025.0 – 25.06.6—
6West Craven9.0-3.024.624.5 – 24.63.4—
7T Wingate Andrews11.0-1.024.024.0 – 24.0-0.8—
8Tuscola10.0-2.020.220.2 – 20.30.3—
9East Duplin11.0-1.019.819.7 – 19.81.4—
10West Stokes10.0-2.019.819.7 – 19.81.7—

Rank all 4A teams →

3A — projected top 10
SchoolProj. recordRating10th–90thSOSUnbeaten
1Shelby11.0-1.032.132.1 – 32.14.0—
2Lincolnton9.0-3.025.525.4 – 25.52.0—
3North Stanly11.0-1.023.423.4 – 23.5-8.3—
4Northeastern11.0-1.022.722.7 – 22.85.1—
5James Kenan10.0-1.020.020.0 – 20.1-1.6—
6Eastern Randolph9.0-3.017.017.0 – 17.00.1—
7Walkertown11.0-1.014.914.9 – 14.9-9.8—
8Wallace-Rose Hill7.0-5.014.914.9 – 14.9-2.1—
9Whiteville11.0-0.013.813.8 – 13.9-8.2100%
10Martin County8.0-4.013.713.6 – 13.70.9—

Rank all 3A teams →

NCISAA 8 — projected top 10
SchoolProj. recordRating10th–90thSOSUnbeaten
1John Paul II Catholic10.9-2.118.216.5 – 20.0-8.6—
2Cary Christian9.0-2.014.212.7 – 15.8-8.1—
3Faith Christian8.0-2.06.14.4 – 7.8-9.1—
4Pungo Christian Academy8.9-0.12.2-0.8 – 5.3-37.395%
5Liberty Christian Academy6.1-1.9-6.0-9.2 – -2.5-17.1—
6St. David's6.8-4.2-10.1-12.0 – -8.4-10.2—
7Lawrence Academy6.8-4.2-11.0-12.6 – -9.4-18.2—
8Sandhills Classical Christian3.0-4.0-19.9-23.2 – -16.3-20.5—
9Wake Christian Academy2.7-9.3-19.9-21.4 – -18.3-7.1—
10Arendell Parrott Academy2.5-6.5-26.7-29.1 – -24.4-3.6—

Rank all NCISAA 8 teams →

2A — projected top 10
SchoolProj. recordRating10th–90thSOSUnbeaten
1Tarboro11.0-1.027.027.0 – 27.1-2.6—
2Corvian Community11.0-1.022.422.4 – 22.5-1.1—
3Holmes10.0-1.020.920.9 – 21.0-9.7—
4Warren County12.0-0.020.720.6 – 20.8-22.0100%
5Starmount11.0-1.016.516.4 – 16.5-8.4—
6Community School of Davidson9.0-3.013.413.3 – 13.4-4.4—
7East Wilkes7.0-5.010.710.7 – 10.8-2.6—
8Murphy10.0-2.010.310.3 – 10.3-8.6—
9Alleghany7.0-4.02.92.8 – 2.9-6.0—
10Christ the King7.0-4.02.01.9 – 2.2-8.6—

Rank all 2A teams →

8-MAN — projected top 2
SchoolProj. recordRating10th–90thSOSUnbeaten
1Community Christian6.0-4.0-13.9-15.4 – -12.4-21.6—
2Father Capodanno2.0-5.0-30.0-31.3 – -28.6-16.3—

Rank all 8-MAN teams →

1A — projected top 10
SchoolProj. recordRating10th–90thSOSUnbeaten
1Northside12.0-0.08.48.3 – 8.5-25.5100%
2Robbinsville7.0-5.05.04.9 – 5.0-9.5—
3Wilson Preparatory Academy7.0-5.02.42.3 – 2.5-4.3—
4Chatham Central12.0-0.0-11.8-11.8 – -11.8-31.4100%
5Rosman6.0-6.0-15.2-15.3 – -15.2-17.6—
6Winston-Salem Preparatory Acad6.0-5.0-17.7-17.7 – -17.6-23.6—
7East Columbus Junior-Senior5.0-7.0-22.2-22.2 – -22.1-14.0—
8Hobgood Charter9.0-2.0-23.9-24.0 – -23.7-37.9—
9Sallie B Howard7.0-4.0-24.3-24.5 – -24.2-27.0—
10North Edgecombe7.0-5.0-24.9-25.0 – -24.8-22.5—

Rank all 1A teams →

Most likely to finish unbeaten

SchoolClassProj. recordRating10th–90thSOSUnbeaten
1Hough8A12.0-0.063.863.8 – 63.827.4100%
2Grimsley7A12.0-0.056.856.7 – 56.819.5100%
3Weddington7A12.0-0.056.456.4 – 56.422.5100%
4Lake Norman7A12.0-0.053.253.1 – 53.218.0100%
5Northside5A12.0-0.040.640.6 – 40.614.3100%
6Jay M Robinson5A12.0-0.040.240.2 – 40.23.7100%
7Southeast Alamance5A12.0-0.033.032.9 – 33.09.9100%
8Hibriten4A12.0-0.027.327.2 – 27.3-8.8100%
9Warren County2A12.0-0.020.720.6 – 20.8-22.0100%
10Whiteville3A11.0-0.013.813.8 – 13.9-8.2100%
11Hendersonville3A12.0-0.013.013.0 – 13.0-10.0100%
12Northside1A12.0-0.08.48.3 – 8.5-25.5100%

Strength of classification

Mean is the average member rating. Fitted level is what games between classifications say the tier is worth, which is the real comparison.

GroupTeamsMeanFitted level
8A32+23.2+22.8
NCISAA I10+17.8+16.9
7A60+16.4+16.2
6A58+9.7+9.6
5A57+6.4+5.6
NCISAA II9-0.5-0.4
4A56-3.0-3.6
3A55-9.0-10.0
NCISAA 812-12.6-16.5
2A46-15.1-14.9
8-MAN2-21.9-17.6
1A26-29.5-28.4

Strength of conference

Four or more teams.

GroupTeamsMean
Greater Neuse River7+28.3
Meck Power Six6+27.9
Big Carolina6+26.1
NCISAA Western4+23.3
Central Piedmont6+23.2
NCISAA Big South4+23.1
CAP8+22.5
Triangle Six6+19.5
Southern Carolina7+19.3
Mid South6+18.4
Carolina Coast7+17.8
Greater Charlotte6+15.4
Mid Carolina7+15.1
North Piedmont6+15.0
Quad City Seven7+15.0

Rank all conferences →