Work in progress. This report is in active development.
Ratings and projections will change as the system is refined, and some
sections are not yet complete.
Ratings basis: 5479 2026 results, seeded with 2025Home field: +1.3 ptsGenerated November 07, 2026
Programs That Ended Their Season
First Flight (Kill Devil Hills) stopped on September 18 at 0-4: not enough players to continue the varsity season safely. The Outer Banks Voice
Thomas Jefferson Classical Academy (Mooresboro) stopped on September 23 at 1-3: a large number of serious injuries and too few players remaining. WBTV
West Bladen (Bladenboro) stopped on September 24 at 0-5: not enough healthy players to take the field safely. WITN
Under NCHSAA rules, a school that stops mid-season forfeits each conference game it has left, and those count as wins for the opponents. Its other remaining games are no contest and count for no one.
Week 13 Projections
117 games. Sorted with the closest matchups first.
Friday, November 13 — 117 games
Matchup
Projected result
Confidence
West Wilkes at Chase
Chase22–22
51%
Fairmont at Southwestern Randolph
Fairmont23–22
52%
Sun Valley at Dudley
Dudley23–22
52%
Southeast Collegiate Prep Academy at North Edgecombe
North Edgecombe23–22
53%
Princeton at Midway
Midway23–22
53%
Hickory at Oak Grove
Oak Grove23–22
54%
Leesville Road at Apex Friendship
Leesville Road23–22
54%
Southeast Raleigh at Cardinal Gibbons
Cardinal Gibbons23–21
55%
Lexington at Morehead
Lexington23–21
55%
Northern Guilford at Alexander Central
Northern Guilford24–21
59%
Wilkes Central at Mount Pleasant
Mount Pleasant25–21
61%
Ashbrook at Mount Tabor
Mount Tabor25–21
62%
West Columbus at Southside
West Columbus25–21
63%
Hickory Ridge at East Forsyth
East Forsyth26–21
64%
John Paul II Catholic at Faith Christian
John Paul II Catholic26–21
64%
Cherryville at Alleghany
Alleghany26–20
66%
Mooresville at Marvin Ridge
Marvin Ridge27–20
69%
Camden County at Manteo
Manteo27–20
70%
Seventy-First at Middle Creek
Middle Creek28–20
71%
Cannon [Cannon/Concord Academy] at Rabun Gap-Nacoochee (GA)
Rabun Gap-Nacoochee (GA)28–20
72%
R-S Central at Lake Norman Charter
R-S Central28–20
73%
Triton at Williams
Williams29–19
74%
Christ the King at East Wilkes
East Wilkes29–19
76%
East Columbus Junior-Senior at Winston-Salem Preparatory Acad
Winston-Salem Preparatory Acad29–19
76%
Rocky Mount at Havelock
Havelock29–19
76%
Farmville Central at Hertford County
Hertford County30–19
77%
D H Conley at Cape Fear
Cape Fear30–19
77%
Enka at West Rowan
West Rowan30–19
78%
Southwest at Clinton
Clinton30–19
78%
Charlotte Catholic at Freedom
Charlotte Catholic30–19
79%
North Duplin Jr Sr at Gates County
Gates County30–19
79%
Harnett Central at Southern Alamance
Southern Alamance30–19
79%
Mitchell at Mountain Island Charter
Mitchell30–19
79%
Trinity Christian at High Point Christian Academy
High Point Christian Academy31–19
80%
Myers Park at West Forsyth
West Forsyth31–18
80%
Davie County at Page
Page31–18
81%
Wallace-Rose Hill at Pasquotank County
Wallace-Rose Hill32–18
83%
Greene Central at Northeastern
Northeastern32–18
83%
Ashley at New Bern
New Bern33–18
85%
Eastern Guilford at Asheboro
Asheboro33–18
86%
Bertie at East Bladen
East Bladen34–17
86%
Pinecrest at Mallard Creek
Mallard Creek34–17
87%
Maiden at Tuscola
Tuscola34–17
87%
Bunker Hill at Burns
Burns34–17
87%
South Columbus at Martin County
Martin County34–17
87%
South Granville at Seaforth
Seaforth34–17
88%
Western Alamance at Croatan
Croatan35–17
88%
Central Davidson at SouthWest Edgecombe
SouthWest Edgecombe35–17
88%
West Davidson at Thomasville
Thomasville35–17
89%
Smoky Mountain at South Point
South Point35–17
89%
South Rowan at West Stokes
West Stokes35–17
89%
Saint Pauls at Fike
Fike36–16
90%
East Surry at Hendersonville
Hendersonville36–16
91%
Northwood at Whiteville
Whiteville37–16
91%
KIPP Pride at Sallie B Howard
Sallie B Howard37–16
91%
Montgomery Central at Hunt
Hunt37–16
91%
Cherokee at North Rowan
North Rowan37–16
91%
Forest Hills at East Lincoln
East Lincoln38–16
92%
Holly Springs at Southern School of Energy and Sustainability
Southern School of Energy and Sustainability38–16
93%
West Charlotte at Chambers
Chambers38–16
93%
Providence Grove at Eastern Randolph
Eastern Randolph38–15
93%
Washington at East Duplin
East Duplin38–15
93%
North Davidson at Jay M Robinson
Jay M Robinson38–15
93%
Mountain Heritage at Lincolnton
Lincolnton39–15
93%
Jordan at Hoggard
Hoggard39–15
93%
Richmond at Lake Norman
Lake Norman39–15
94%
College Prep and Leadership Academy at Chatham Central
Chatham Central39–15
94%
Northwest Halifax Collegiate and Technical Academy at Lakewood
Lakewood40–15
94%
Anson at T Wingate Andrews
T Wingate Andrews40–15
95%
Reynolds at Asheville
Asheville40–15
95%
Weldon STEM at Hobgood Charter
Hobgood Charter40–15
95%
Randleman at Reidsville
Reidsville40–15
95%
Ragsdale at Roberson
Roberson41–14
95%
Terry Sanford at Union Pines
Union Pines41–14
95%
Union Academy at Mount Airy
Mount Airy41–14
95%
Rosman at Wilson Preparatory Academy
Wilson Preparatory Academy41–14
95%
Watauga at Kings Mountain
Kings Mountain41–14
95%
West Cabarrus at A L Brown
A L Brown41–14
95%
West Henderson at Franklin
Franklin41–14
96%
Ledford at West Craven
West Craven42–14
96%
Westover at Northern Nash
Northern Nash42–14
96%
South Garner at Wake Forest
Wake Forest42–14
96%
St. David's at Cary Christian
Cary Christian42–14
96%
Palisades at Hough
Hough43–14
96%
East Burke at Hibriten
Hibriten43–14
97%
Jack Britt at Reagan
Reagan43–14
97%
Green Hope at Rolesville
Rolesville43–14
97%
West Stanly at West Iredell
West Iredell43–13
97%
Polk County at Walkertown
Walkertown43–13
97%
Providence Day at Christ School
Providence Day43–13
97%
Parkwood at Crest
Crest43–13
97%
South Stanly at Murphy
Murphy43–13
97%
Hobbton at Holmes
Holmes43–13
97%
Louisburg Magnet at James Kenan
James Kenan44–13
97%
Foard at Stuart W Cramer
Stuart W Cramer44–13
97%
SouthLake Christian Academy at Asheville School (Independent)
Scoring tables are as played. Adjusted tables account for the opponent, so ten points conceded to a strong offense outranks a shutout of a weak one — the two disagree on purpose.
The official NCHSAA RPI standings, as published by the association on October 31, 2026 (nchsaa.org, powered by MaxPreps): 0.4 win percentage, 0.4 opponents' win percentage, 0.2 opponents' opponents'. Records are NCHSAA's, which can differ from ours where the association has ruled on a forfeit. This table is more than a week old.
8A — 32 teams
School
Record
RPI
Power
SOS
1
Hough
10-0-0
0.77696
132.1
25.6
2
Chambers
9-1-0
0.71551
118.3
24.0
3
Millbrook
9-0-1
0.71332
123.7
22.2
4
Mallard Creek
8-2-0
0.69461
115.8
32.9
5
Apex Friendship
10-0-0
0.68203
97.9
6.8
6
Hoggard
9-1-0
0.67583
115.5
18.0
7
West Forsyth
8-2-0
0.66243
116.0
24.7
8
Rolesville
7-2-1
0.63639
119.2
25.3
9
Myers Park
7-3-0
0.63611
106.0
24.5
10
Pinecrest
7-3-0
0.63033
101.9
23.1
11
West Charlotte
6-4-0
0.61574
99.2
31.4
12
Palisades
8-2-0
0.60987
105.7
15.9
13
Green Hope
8-2-0
0.59489
91.8
2.0
14
Jordan
7-3-0
0.58619
95.7
10.8
15
Ardrey Kell
7-3-0
0.57644
93.8
17.1
16
Leesville Road
6-4-0
0.56654
100.4
20.8
17
Panther Creek
6-4-0
0.56117
85.1
15.2
18
Laney
5-5-0
0.55650
92.6
22.9
19
Hoke County
5-5-0
0.54611
89.6
23.8
20
Providence
5-5-0
0.52528
91.4
20.8
21
Broughton
5-5-0
0.50422
83.1
21.4
22
Wakefield
4-6-0
0.47898
76.6
23.3
23
South Mecklenburg
4-6-0
0.47319
79.3
18.0
24
Willow Spring
3-7-0
0.44869
75.4
16.6
25
Enloe
4-6-0
0.43711
79.8
19.2
26
Northwest Guilford
2-8-0
0.41876
74.0
26.2
27
Apex
3-7-0
0.41050
79.8
9.5
28
East Mecklenburg
4-6-0
0.40356
73.2
8.4
29
Corinth Holders
2-8-0
0.39222
80.4
20.0
30
Athens Drive
2-8-0
0.36625
68.7
18.4
31
Garinger
2-8-0
0.33672
51.0
8.7
32
Green Level
1-9-0
0.32269
62.9
12.4
7A — 60 teams
School
Record
RPI
Power
SOS
1
Weddington
10-0-0
0.76408
127.2
24.6
2
Grimsley
10-0-0
0.75387
124.2
19.1
3
Lake Norman
10-0-0
0.71111
120.8
17.0
4
Cleveland
9-1-0
0.71100
117.7
26.2
5
Garner
8-2-0
0.68978
113.5
28.6
6
Reagan
8-2-0
0.68906
116.4
25.5
7
A L Brown
10-0-0
0.67267
104.0
8.0
8
Marvin Ridge
9-1-0
0.66653
107.2
17.1
9
Clayton
8-2-0
0.66246
114.8
20.3
10
Southern School of Energy and Sustainability
9-1-0
0.65865
105.8
2.6
11
New Bern
7-3-0
0.65352
99.8
23.0
12
Wake Forest
8-2-0
0.65081
109.0
13.6
13
Cardinal Gibbons
7-3-0
0.63824
112.7
24.3
14
Page
9-1-0
0.63506
107.4
5.9
15
East Forsyth
7-3-0
0.62840
110.6
23.2
16
Cape Fear
8-2-0
0.61333
96.2
8.4
17
D H Conley
6-4-0
0.60976
87.6
17.5
18
Southeast Raleigh
7-3-0
0.60683
112.2
21.1
19
Hickory Ridge
8-2-0
0.60200
107.3
5.1
20
Davie County
6-4-0
0.59378
96.9
20.3
21
Hillside
7-3-0
0.57786
79.7
3.3
22
Mooresville
5-5-0
0.57333
102.1
26.0
23
Ashley
6-4-0
0.55328
87.1
17.1
24
West Cabarrus
5-5-0
0.54200
81.2
15.3
25
Jack Britt
5-5-0
0.52633
89.2
20.3
26
Holly Springs
5-5-0
0.52393
86.8
15.1
27
South Central
4-6-0
0.52258
86.2
19.2
28
Heritage
5-5-0
0.51961
79.5
15.3
29
Richmond
4-6-0
0.50778
100.2
24.9
30
Butler
4-6-0
0.50482
93.2
27.2
31
Fuquay-Varina
4-6-0
0.50033
86.9
23.8
32
Topsail
4-6-0
0.49715
83.8
20.0
33
North Brunswick
5-5-0
0.48644
80.1
11.8
34
Hopewell
5-5-0
0.47711
80.8
14.8
35
Sanderson
5-5-0
0.47489
83.3
8.0
36
Porter Ridge
3-7-0
0.46519
84.8
23.8
37
Independence
2-8-0
0.44853
85.5
29.2
38
Overhills
4-6-0
0.44700
80.0
13.9
39
Ballantyne Ridge
4-6-0
0.43321
77.2
11.1
40
R J Reynolds
4-6-0
0.43206
76.8
11.2
41
Pine Forest
3-7-0
0.42656
73.5
18.6
42
South Garner
3-7-0
0.42656
84.0
17.6
43
Parkland
3-7-0
0.41206
66.4
9.2
44
New Hanover
2-8-0
0.41125
75.3
21.4
45
South Iredell
2-8-0
0.39578
73.8
22.2
46
Lumberton
2-8-0
0.39422
65.0
12.5
47
Chapel Hill
3-7-0
0.39384
46.0
0.7
48
East Wake
3-7-0
0.39215
68.5
8.5
49
North Mecklenburg
3-7-0
0.38697
85.0
16.6
50
Purnell Swett
3-7-0
0.37833
67.2
1.4
51
Cary
3-7-0
0.37394
66.2
11.3
52
Southwest Guilford
2-8-0
0.37133
60.1
11.1
53
West Mecklenburg
2-8-0
0.37032
70.7
12.8
54
Cuthbertson
1-9-0
0.36275
66.4
20.8
55
Riverside
2-8-0
0.36014
56.2
1.9
56
Cox Mill
2-8-0
0.34933
64.8
9.8
57
McDowell
1-9-0
0.33919
52.5
2.5
58
Smithfield-Selma
0-10-0
0.32383
56.1
21.5
59
Knightdale
1-9-0
0.32302
58.6
9.1
60
Rocky River
0-10-0
0.24422
49.4
9.0
6A — 58 teams
School
Record
RPI
Power
SOS
1
Junius H Rose
10-0-0
0.77494
116.2
23.2
2
Asheville
9-1-0
0.72742
99.5
15.0
3
Jacksonville
7-2-0
0.69647
113.6
19.1
4
Northern Nash
8-2-0
0.69008
112.4
16.2
5
Scotland
9-1-0
0.68619
107.6
14.0
6
Union Pines
9-1-0
0.68315
98.8
4.8
7
Southern Alamance
8-2-0
0.67483
98.2
12.0
8
Roberson
8-2-0
0.66492
108.1
10.5
9
Williams
6-2-0
0.66395
91.4
14.1
10
Middle Creek
8-2-0
0.66186
110.4
19.6
11
Asheboro
9-1-0
0.65316
90.4
5.4
12
Seventy-First
9-1-0
0.64111
104.4
7.4
13
Triton
9-1-0
0.64081
84.1
1.5
14
Kings Mountain
7-3-0
0.61297
105.1
15.2
15
Mount Tabor
6-4-0
0.59519
96.7
21.0
16
Harnett Central
8-2-0
0.59359
88.6
-3.1
17
Franklinton
8-2-0
0.58725
86.5
-0.4
18
Alexander Central
8-2-0
0.58333
87.4
3.1
19
Freedom
8-2-0
0.58156
83.9
-2.2
20
Swansboro
7-3-0
0.58096
77.2
-0.6
21
Dudley
6-4-0
0.55785
93.1
17.4
22
Sun Valley
5-5-0
0.55475
93.4
24.6
23
Charlotte Catholic
6-4-0
0.54874
95.3
19.2
24
Northern Guilford
6-4-0
0.54813
91.4
12.9
25
Ashbrook
5-5-0
0.54378
94.0
15.1
26
Westover
6-4-0
0.53444
87.6
8.0
27
Watauga
5-5-0
0.51378
82.4
6.0
28
Glenn
6-4-0
0.51339
79.3
7.4
29
Ragsdale
5-5-0
0.50172
85.5
8.6
30
Gray's Creek
6-4-0
0.49422
76.2
4.4
31
Reynolds
3-7-0
0.48031
77.5
13.7
32
Statesville
4-6-0
0.46889
83.4
14.1
33
South Johnston
4-6-0
0.46711
72.6
2.8
34
Felton Grove
4-6-0
0.46191
64.8
6.9
35
Phillip O Berry Academy of Technology
5-5-0
0.45733
66.8
9.4
36
Northern
5-5-0
0.45683
55.0
-8.1
37
Eastern Guilford
3-6-0
0.45412
77.4
10.6
38
Olympic
4-6-0
0.44800
76.3
13.2
39
West Johnston
4-6-0
0.44359
66.8
6.9
40
Central Cabarrus
3-7-0
0.43022
74.0
11.8
41
White Oak
2-7-0
0.42683
65.5
15.9
42
Terry Sanford
3-7-0
0.42222
76.2
14.3
43
South Caldwell
3-7-0
0.42000
55.3
8.2
44
Piedmont
3-7-0
0.41831
73.9
15.5
45
Western Harnett
4-6-0
0.41408
52.7
-4.5
46
South View
3-7-0
0.41222
78.8
12.6
47
Saint Stephens
3-7-0
0.41200
74.0
5.3
48
Lee County
2-8-0
0.41137
65.5
10.1
49
Western Guilford
3-7-0
0.40596
56.1
7.5
50
West Brunswick
2-8-0
0.40512
72.1
12.3
51
Southeast Guilford
3-7-0
0.39314
67.6
6.5
52
Vance County
1-9-0
0.37821
57.1
13.0
53
E E Smith
2-8-0
0.36069
73.8
8.5
54
Harding University
2-8-0
0.36032
65.7
11.5
55
Ben L. Smith
1-9-0
0.32594
52.2
9.5
56
North Iredell
0-10-0
0.30644
40.2
15.6
57
Southern Lee
0-10-0
0.30426
41.4
9.1
58
East Chapel Hill
1-8-0
0.29128
30.9
-12.2
5A — 57 teams
School
Record
RPI
Power
SOS
1
Southeast Alamance
10-0-0
0.74416
98.7
8.8
2
Crest
9-1-0
0.73978
110.0
20.4
3
Northside
10-0-0
0.72592
107.0
12.4
4
Franklin
10-0-0
0.71464
98.6
3.4
5
Jay M Robinson
10-0-0
0.70850
109.9
3.5
6
South Point
9-1-0
0.70528
107.2
17.1
7
Hunt
9-1-0
0.70053
93.6
12.5
8
Monroe
8-2-0
0.67422
107.4
16.3
9
West Rowan
8-2-0
0.66978
90.9
6.4
10
East Lincoln
9-1-0
0.66689
104.7
12.0
11
Croatan
9-1-0
0.66289
94.6
3.8
12
Seaforth
9-1-0
0.64117
81.8
-13.4
13
Oak Grove
8-2-0
0.63764
108.5
9.5
14
Hickory
7-3-0
0.62667
108.4
13.9
15
Forest Hills
8-2-0
0.62614
86.2
4.7
16
Fike
8-2-0
0.62222
100.5
3.9
17
Enka
8-2-0
0.61791
82.1
1.0
18
Eastern Alamance
7-2-0
0.61778
99.0
9.6
19
Northwest Cabarrus
7-3-0
0.59511
82.0
6.3
20
Smoky Mountain
8-2-0
0.59217
92.1
-3.7
21
Havelock
5-5-0
0.58689
94.1
17.9
22
North Davidson
7-3-0
0.57306
90.4
5.3
23
Rocky Mount
6-4-0
0.56233
86.0
7.8
24
Orange
6-4-0
0.53706
67.6
-8.8
25
West Henderson
5-5-0
0.52936
74.7
4.4
26
Saint Pauls
7-3-0
0.52578
84.1
-0.5
27
Parkwood
5-5-0
0.52523
81.9
13.1
28
South Granville
6-4-0
0.51907
67.2
-8.8
29
Western Alamance
5-5-0
0.51632
79.9
8.3
30
Erwin
4-6-0
0.50514
76.2
10.1
31
Montgomery Central
5-5-0
0.50423
76.2
6.0
32
Southern Nash
4-6-0
0.50245
75.3
12.8
33
West Carteret
4-6-0
0.49178
66.3
9.0
34
Carson
4-6-0
0.47836
69.2
4.4
35
Currituck County
4-6-0
0.47280
65.3
0.2
36
Rockingham County
4-6-0
0.46800
68.8
-2.9
37
J. F. Webb
4-6-0
0.45833
57.2
-11.1
38
Southern Wayne
4-6-0
0.45545
58.0
4.2
39
South Brunswick
5-5-0
0.45534
63.4
-8.4
40
East Rowan
4-6-0
0.45467
63.2
3.1
41
North Buncombe
4-6-0
0.44217
64.5
1.8
42
North Lincoln
3-7-0
0.43644
73.1
14.0
43
North Henderson
2-8-0
0.43156
66.3
8.6
44
Person
2-8-0
0.42256
67.5
12.3
45
Forestview
2-8-0
0.41714
65.4
14.2
46
Huss
3-7-0
0.40898
76.7
13.5
47
Richlands
2-8-0
0.40205
60.8
8.0
48
Charles B Aycock
2-8-0
0.39617
63.8
7.2
49
Concord
1-9-0
0.36578
56.8
6.3
50
Atkins
2-8-0
0.36572
49.0
6.7
51
Dixon
2-8-0
0.36431
65.4
4.0
52
Northeast Guilford
1-9-0
0.36144
84.1
18.1
53
North Forsyth Magnet
1-9-0
0.32771
48.0
6.6
54
North Gaston
0-10-0
0.29378
35.8
12.1
55
Southern Guilford
1-9-0
0.28910
33.6
7.2
56
Cedar Ridge
1-7-0
0.28555
19.0
-18.4
57
Douglas Byrd
0-10-0
0.26517
37.3
5.3
4A — 55 teams
School
Record
RPI
Power
SOS
1
East Duplin
9-1-0
0.67714
89.1
1.8
2
Hibriten
10-0-0
0.67035
97.2
-8.0
3
Tuscola
9-1-0
0.66958
95.8
0.0
4
West Iredell
9-1-0
0.65756
95.9
7.4
5
T Wingate Andrews
9-1-0
0.63989
92.7
1.2
6
Clinton
7-3-0
0.63179
76.9
-3.0
7
West Craven
8-2-0
0.62240
94.0
2.3
8
Burns
7-3-0
0.61067
92.1
5.4
9
Mount Pleasant
7-3-0
0.60844
81.1
9.3
10
West Stokes
8-2-0
0.60631
85.9
0.6
11
Reidsville
7-3-0
0.59914
93.9
-1.1
12
SouthWest Edgecombe
7-3-0
0.59523
81.2
2.9
13
Stuart W Cramer
8-2-0
0.58822
94.5
-6.2
14
Lake Norman Charter
7-3-0
0.58022
68.3
-6.5
15
R-S Central
7-3-0
0.56670
77.1
-5.7
16
Pisgah
6-4-0
0.56078
76.2
3.0
17
South Rowan
6-4-0
0.53800
70.0
-5.1
18
Wilkes Central
7-3-0
0.53781
78.8
-13.8
19
Morehead
7-3-0
0.53747
62.2
-11.9
20
Bunker Hill
6-4-0
0.52956
78.0
6.8
21
Southwestern Randolph
7-3-0
0.52565
68.5
-19.1
22
West Stanly
4-6-0
0.52117
68.2
7.7
23
Maiden
5-5-0
0.52022
81.8
14.2
24
Fairmont
5-5-0
0.51728
70.3
-4.6
25
East Burke
5-5-0
0.51414
70.1
-2.5
26
Roanoke Rapids
5-5-0
0.50538
60.1
-10.7
27
North Surry
5-5-0
0.49896
66.0
-4.9
28
Nash Central
4-6-0
0.49405
64.6
1.4
29
Randleman
4-6-0
0.48023
71.7
3.2
30
Newton-Conover
4-6-0
0.47917
77.1
12.3
31
Ledford
4-6-0
0.47725
69.6
3.9
32
North Pitt
5-5-0
0.47403
66.7
1.3
33
Salisbury
3-7-0
0.47289
56.9
10.2
34
East Gaston
5-5-0
0.46822
56.4
-1.5
35
Bunn
5-5-0
0.46735
64.6
-10.3
36
Washington
3-7-0
0.46011
69.7
6.3
37
Eastern Wayne
5-4-0
0.44599
73.2
-10.5
38
Anson
4-6-0
0.44456
70.9
-0.2
39
Southwest
4-6-0
0.44010
67.8
-3.0
40
Bandys
3-7-0
0.43844
75.2
15.7
41
Forbush
4-6-0
0.42069
52.7
-10.0
42
Jordan-Matthews
4-6-0
0.40783
36.8
-16.7
43
Foard
2-8-0
0.40578
65.7
12.7
44
Cummings
1-9-0
0.39790
57.6
10.4
45
Central Davidson
3-7-0
0.39047
66.4
1.0
46
Lincoln Charter
2-8-0
0.39008
41.7
-5.1
47
Lexington
2-8-0
0.37337
64.8
1.5
48
Carver
3-7-0
0.37006
38.7
-12.3
49
East Henderson
1-9-0
0.35089
48.5
2.9
50
Ashe County
1-9-0
0.34647
40.1
-1.2
51
North Johnston
2-8-0
0.34154
52.6
-2.2
52
Brevard
1-9-0
0.33936
53.4
7.0
53
Red Springs
2-8-0
0.32895
32.5
-2.1
54
Carrboro
1-9-0
0.29178
30.2
-17.7
55
North Lenoir
0-10-0
0.25050
40.3
-1.6
3A — 53 teams
School
Record
RPI
Power
SOS
1
Northeastern
9-1-0
0.71405
91.3
3.5
2
Whiteville
9-0-0
0.71352
82.0
-9.8
3
North Stanly
10-0-0
0.70497
95.9
-8.6
4
Shelby
9-1-0
0.69067
100.5
4.6
5
Midway
8-1-0
0.67172
81.2
-3.4
6
Hendersonville
10-0-0
0.66975
83.8
-9.4
7
James Kenan
8-1-0
0.66121
89.7
-2.4
8
Walkertown
9-1-0
0.63512
81.7
-10.6
9
Martin County
7-3-0
0.62617
82.1
-0.3
10
Eastern Randolph
7-3-0
0.62240
87.0
-0.2
11
Thomasville
9-1-0
0.61280
86.2
-13.4
12
Mount Airy
7-3-0
0.60547
82.7
9.6
13
Chase
8-2-0
0.58331
68.6
-13.5
14
Lincolnton
7-3-0
0.57378
93.1
-0.7
15
Mountain Heritage
7-3-0
0.56942
73.3
-9.3
16
Hertford County
6-4-0
0.56843
79.4
3.5
17
West Wilkes
7-3-0
0.55664
69.3
-11.4
18
Union Academy
7-3-0
0.55408
60.1
-14.6
19
Pasquotank County
6-4-0
0.55372
71.3
-0.3
20
Wallace-Rose Hill
5-4-0
0.55216
85.0
-4.1
21
Farmville Central
6-4-0
0.54398
70.8
1.4
22
Providence Grove
6-4-0
0.54203
67.6
-11.5
23
West Davidson
7-3-0
0.53581
71.1
-12.3
24
South Columbus
6-4-0
0.52926
67.9
-6.1
25
Louisburg Magnet
7-3-0
0.52088
61.1
-18.4
26
Princeton
5-5-0
0.51577
81.2
-2.7
27
Northwood
5-5-0
0.51415
64.8
-4.2
28
Wake Preparatory Academy
6-4-0
0.51361
60.7
-13.2
29
Greene Central
6-4-0
0.49746
79.6
-9.0
30
Owen
5-5-0
0.48103
58.7
-10.5
31
East Surry
4-6-0
0.47406
67.0
-2.2
32
East Rutherford
3-7-0
0.46540
64.1
3.7
33
North Wilkes
4-6-0
0.44625
63.7
-11.7
34
Kinston
5-5-0
0.44273
72.7
-5.1
35
Pine Lake Preparatory
4-6-0
0.41892
48.7
-11.1
36
Pender
4-6-0
0.41582
68.1
-8.5
37
West Lincoln
3-7-0
0.40133
62.5
-2.1
38
Wheatmore
3-7-0
0.39897
55.0
-13.1
39
Polk County
3-7-0
0.39843
53.7
-9.9
40
East Davidson
3-7-0
0.39008
42.3
-9.3
41
North Moore
0-10-0
0.36292
33.4
1.2
42
Ayden-Grifton
2-8-0
0.36142
57.0
1.6
43
McMichael
2-8-0
0.35694
24.9
-10.7
44
South Lenoir
3-7-0
0.34713
37.4
-12.7
45
Heide Trask
2-8-0
0.33944
37.4
-8.6
46
Patton
1-9-0
0.32667
38.2
-5.3
47
Draughn
0-10-0
0.32614
32.8
1.5
48
Bessemer City
1-9-0
0.32533
36.1
2.1
49
Madison
1-9-0
0.30851
36.3
-9.8
50
Trinity
1-9-0
0.30719
25.4
-10.0
51
Bartlett Yancey
1-9-0
0.29315
32.1
-12.2
52
Goldsboro
0-10-0
0.29021
19.7
4.1
53
Beddingfield
0-10-0
0.26539
29.0
-3.4
2A — 45 teams
School
Record
RPI
Power
SOS
1
Corvian Community
9-1-0
0.68200
90.5
0.3
2
Starmount
9-1-0
0.67153
86.5
-6.0
3
Tarboro
9-1-0
0.66991
97.6
0.3
4
Holmes
8-1-0
0.66188
87.6
-9.1
5
Warren County
10-0-0
0.65026
87.3
-22.3
6
Murphy
8-2-0
0.61719
78.2
-5.8
7
Community School of Davidson
7-3-0
0.61158
82.0
-2.7
8
Alleghany
7-3-0
0.60765
74.2
-5.9
9
North Rowan
7-3-0
0.59319
77.4
-7.7
10
Lakewood
7-3-0
0.59074
60.2
-13.0
11
Manteo
7-3-0
0.58220
58.0
-13.8
12
Mountain Island Charter
8-2-0
0.57252
61.6
-17.8
13
East Bladen
7-3-0
0.56987
61.6
-16.3
14
East Wilkes
6-4-0
0.55931
82.1
-3.8
15
Christ the King
7-3-0
0.55810
74.1
-10.5
16
Mitchell
7-3-0
0.54628
73.3
-10.2
17
Southside
7-3-0
0.54371
47.1
-24.4
18
Cherokee
6-4-0
0.52911
59.9
-9.6
19
Cherryville
6-4-0
0.51781
70.1
-8.8
20
Gates County
5-5-0
0.50966
62.7
-11.3
21
North Duplin Jr Sr
5-4-0
0.48778
53.5
-22.6
22
West Columbus
5-5-0
0.47518
52.6
-14.5
23
Bertie
3-7-0
0.46334
48.1
-3.5
24
Albemarle
4-6-0
0.45319
49.4
-12.7
25
Camden County
4-6-0
0.45063
52.5
-13.8
26
South Stokes
5-5-0
0.44686
40.9
-24.1
27
Northwest Halifax Collegiate and Technical Academy
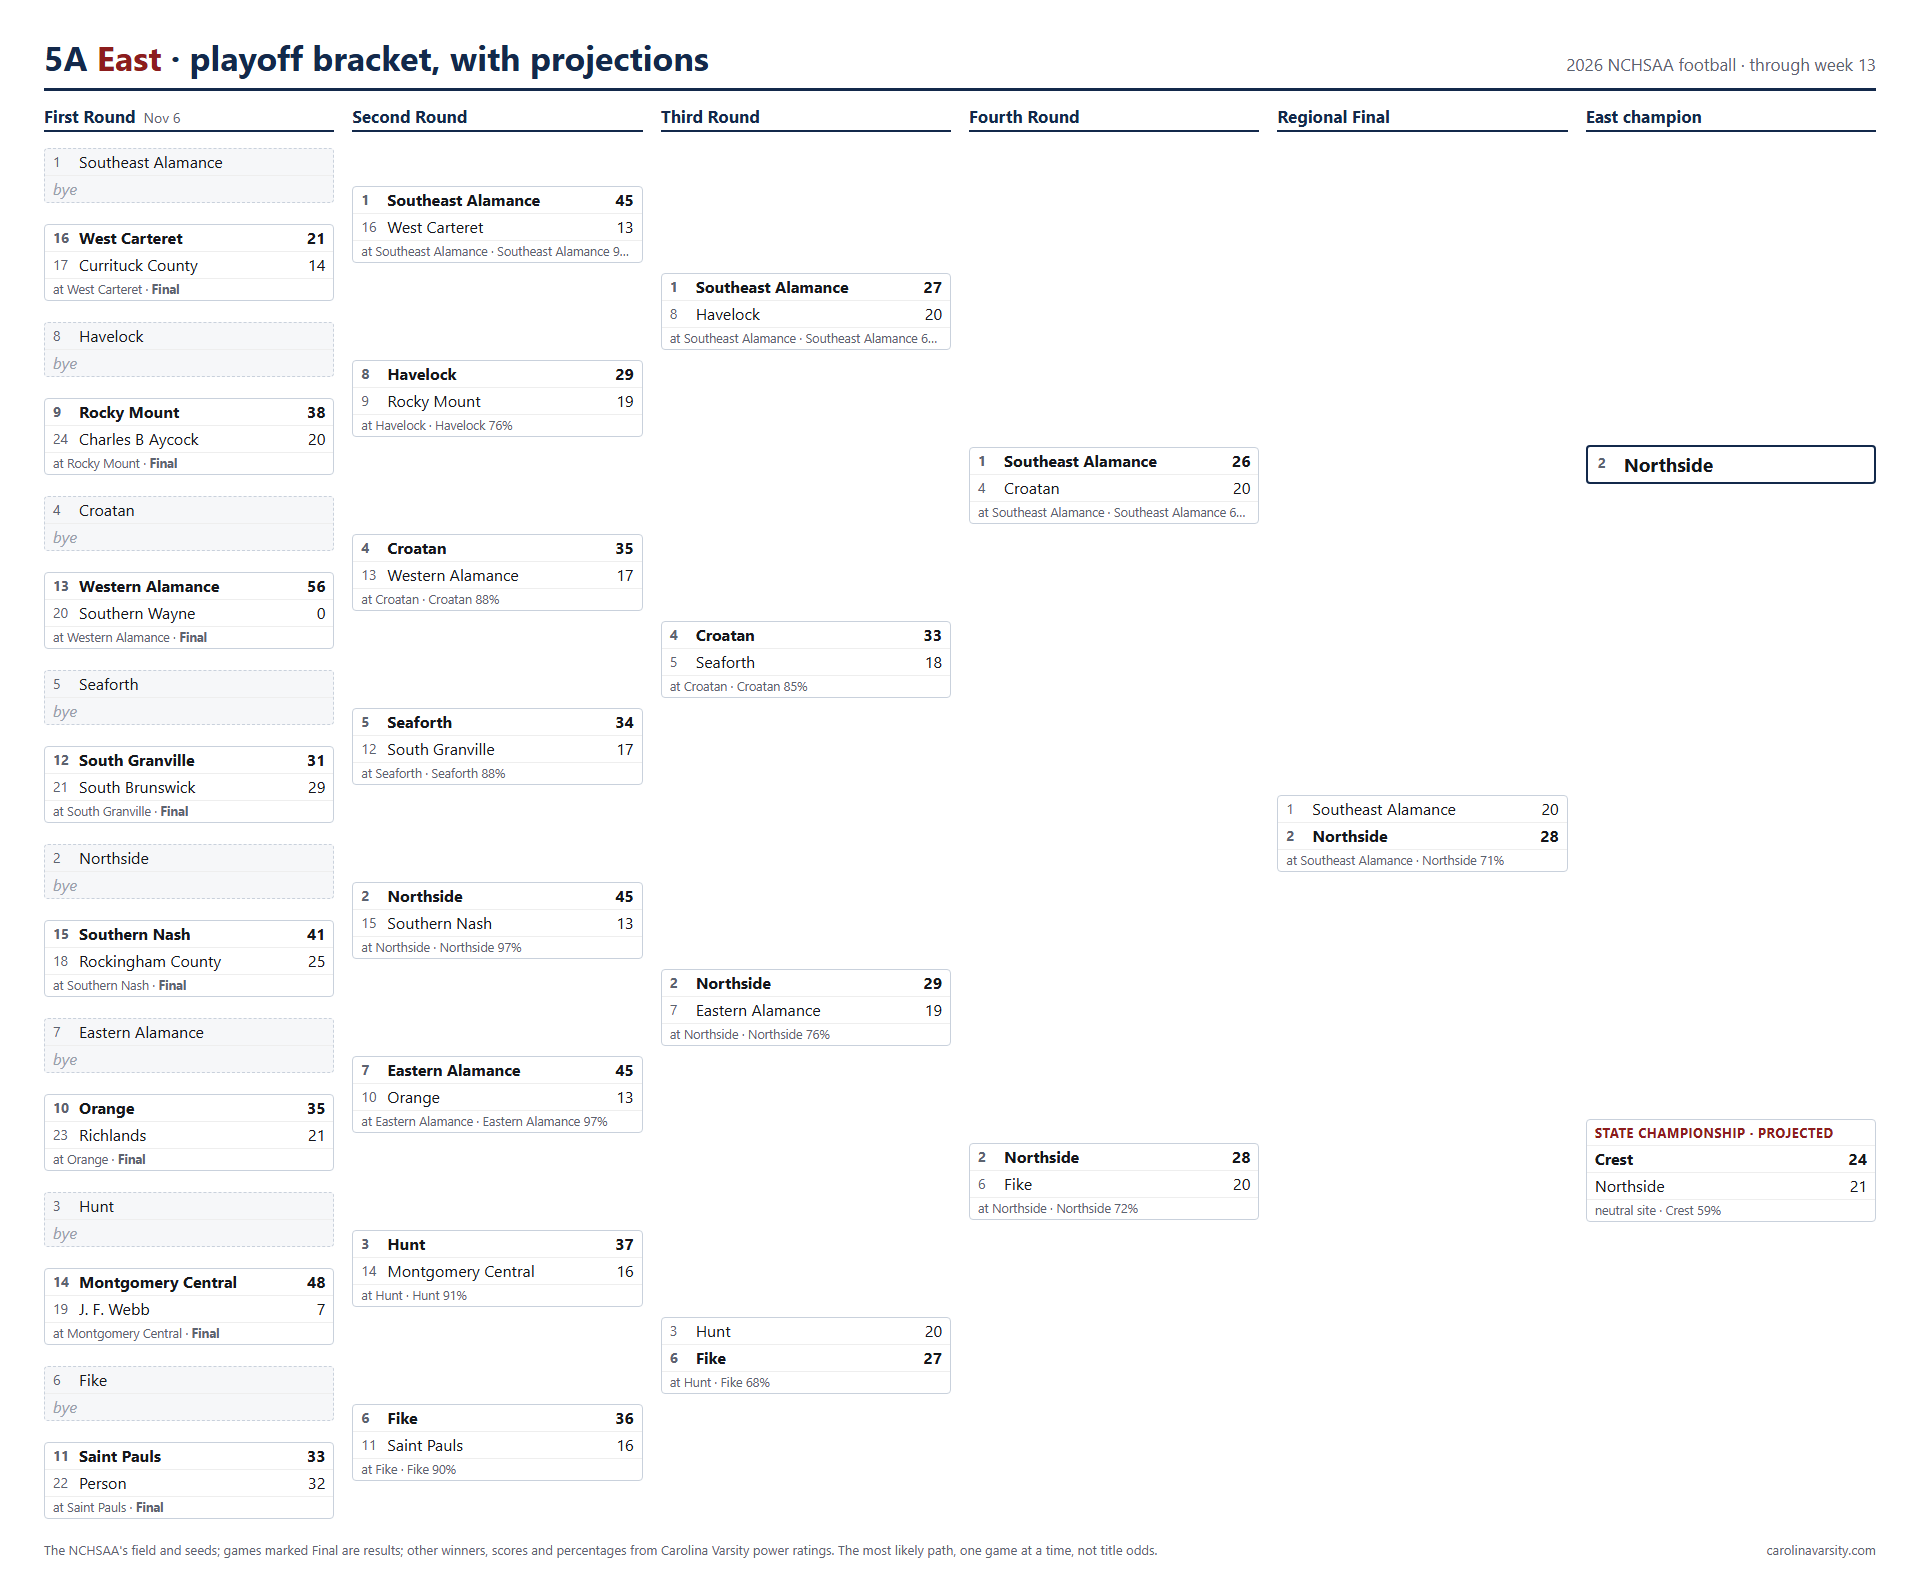
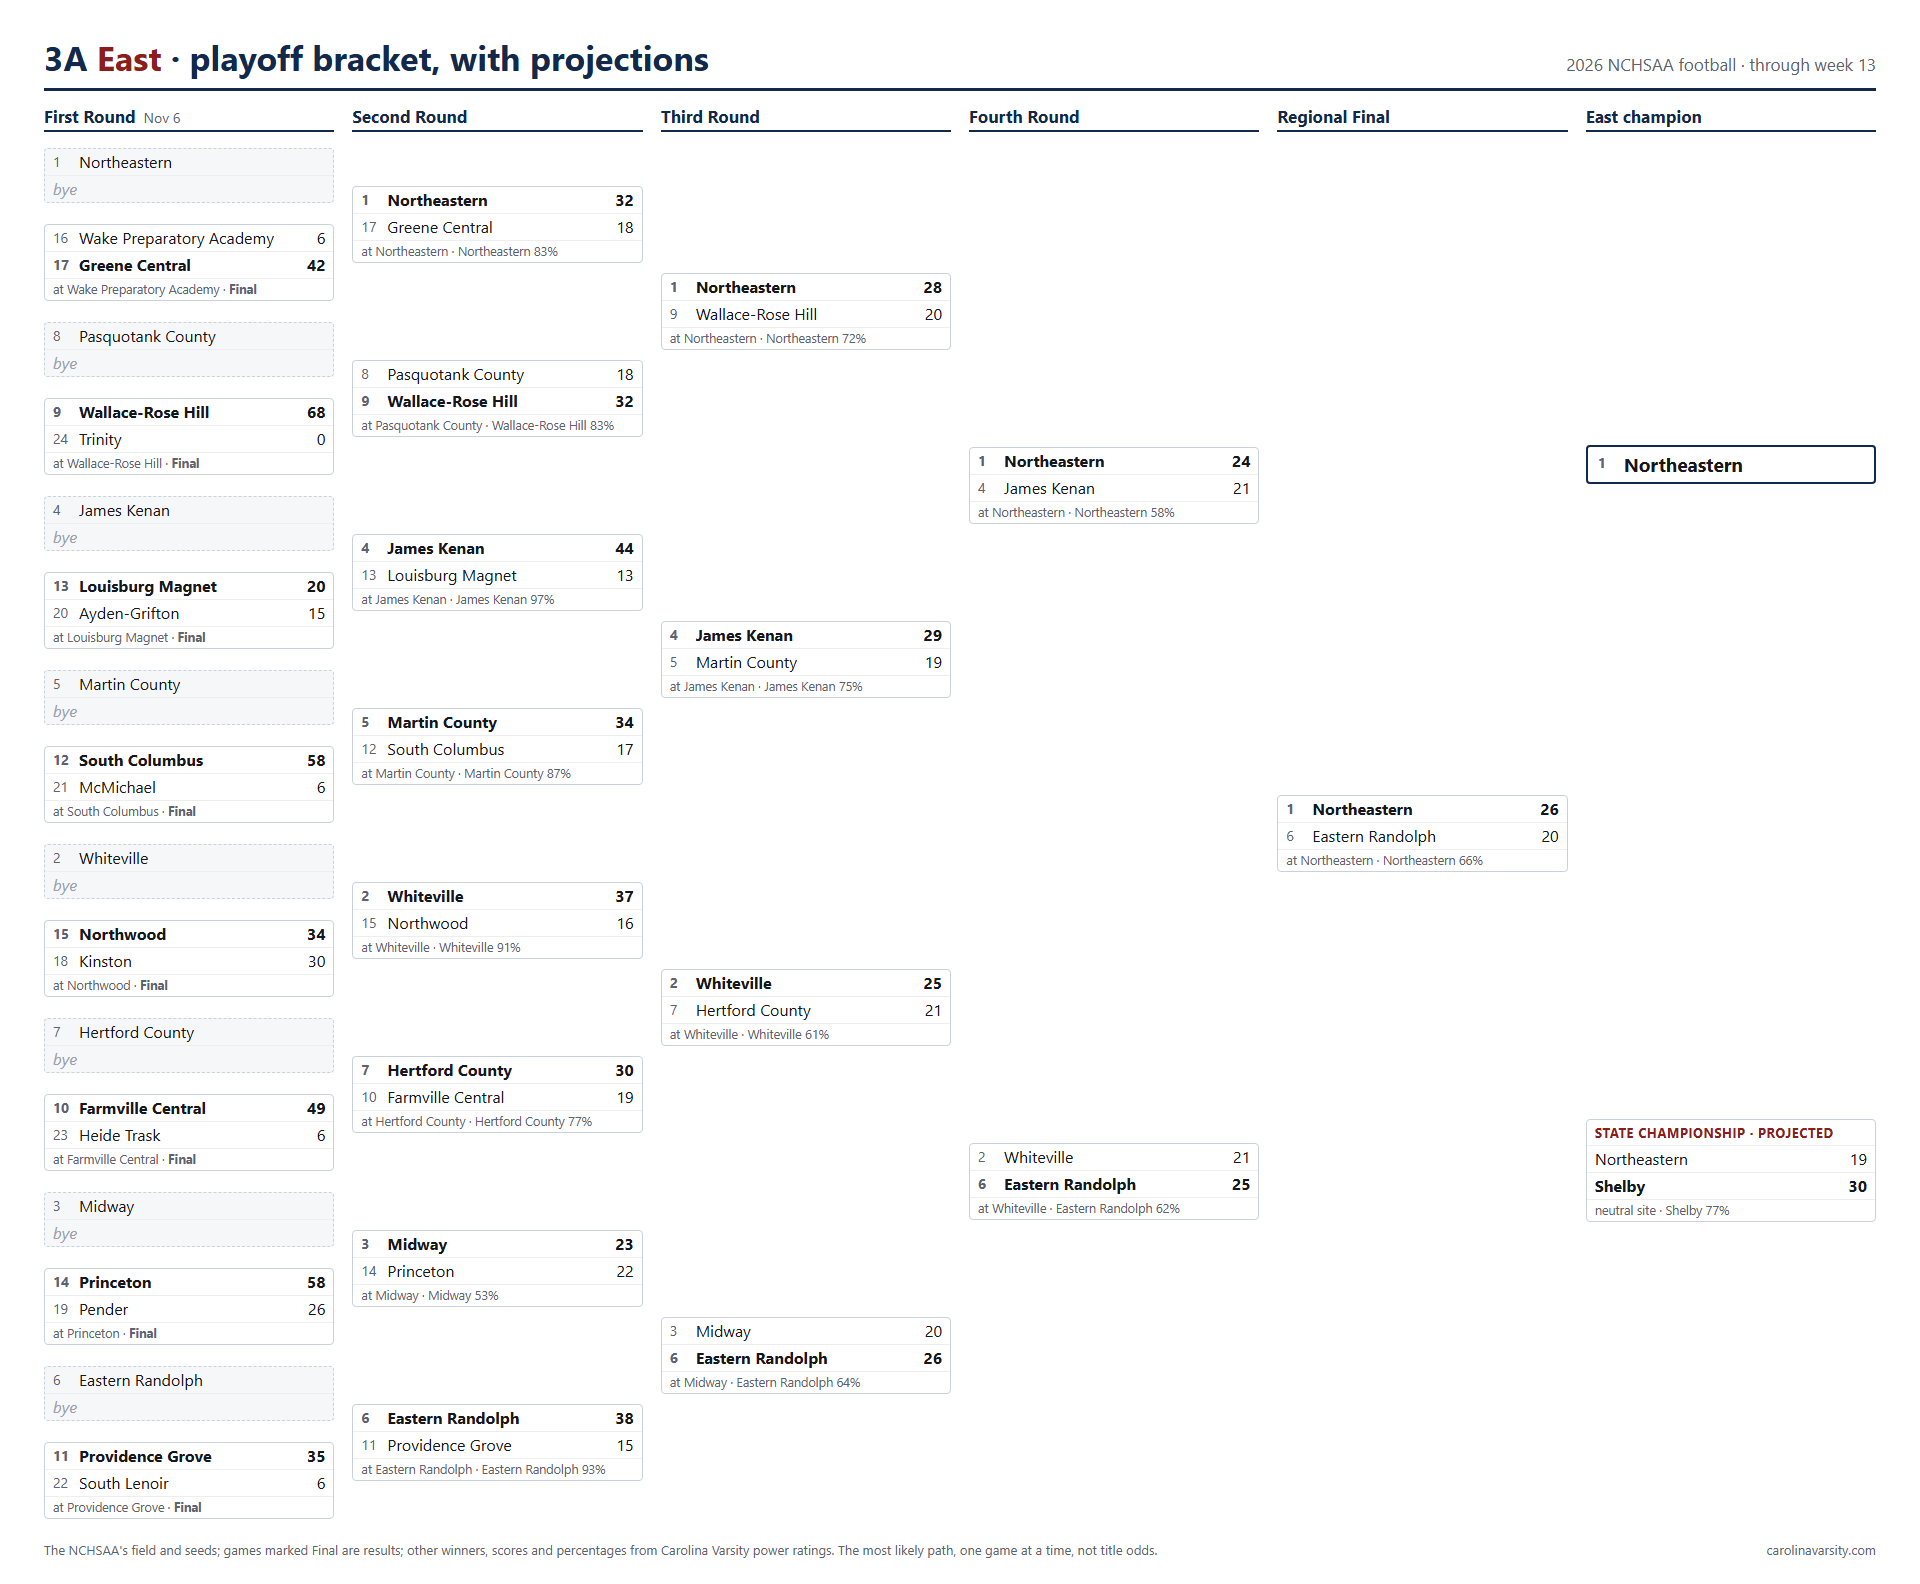
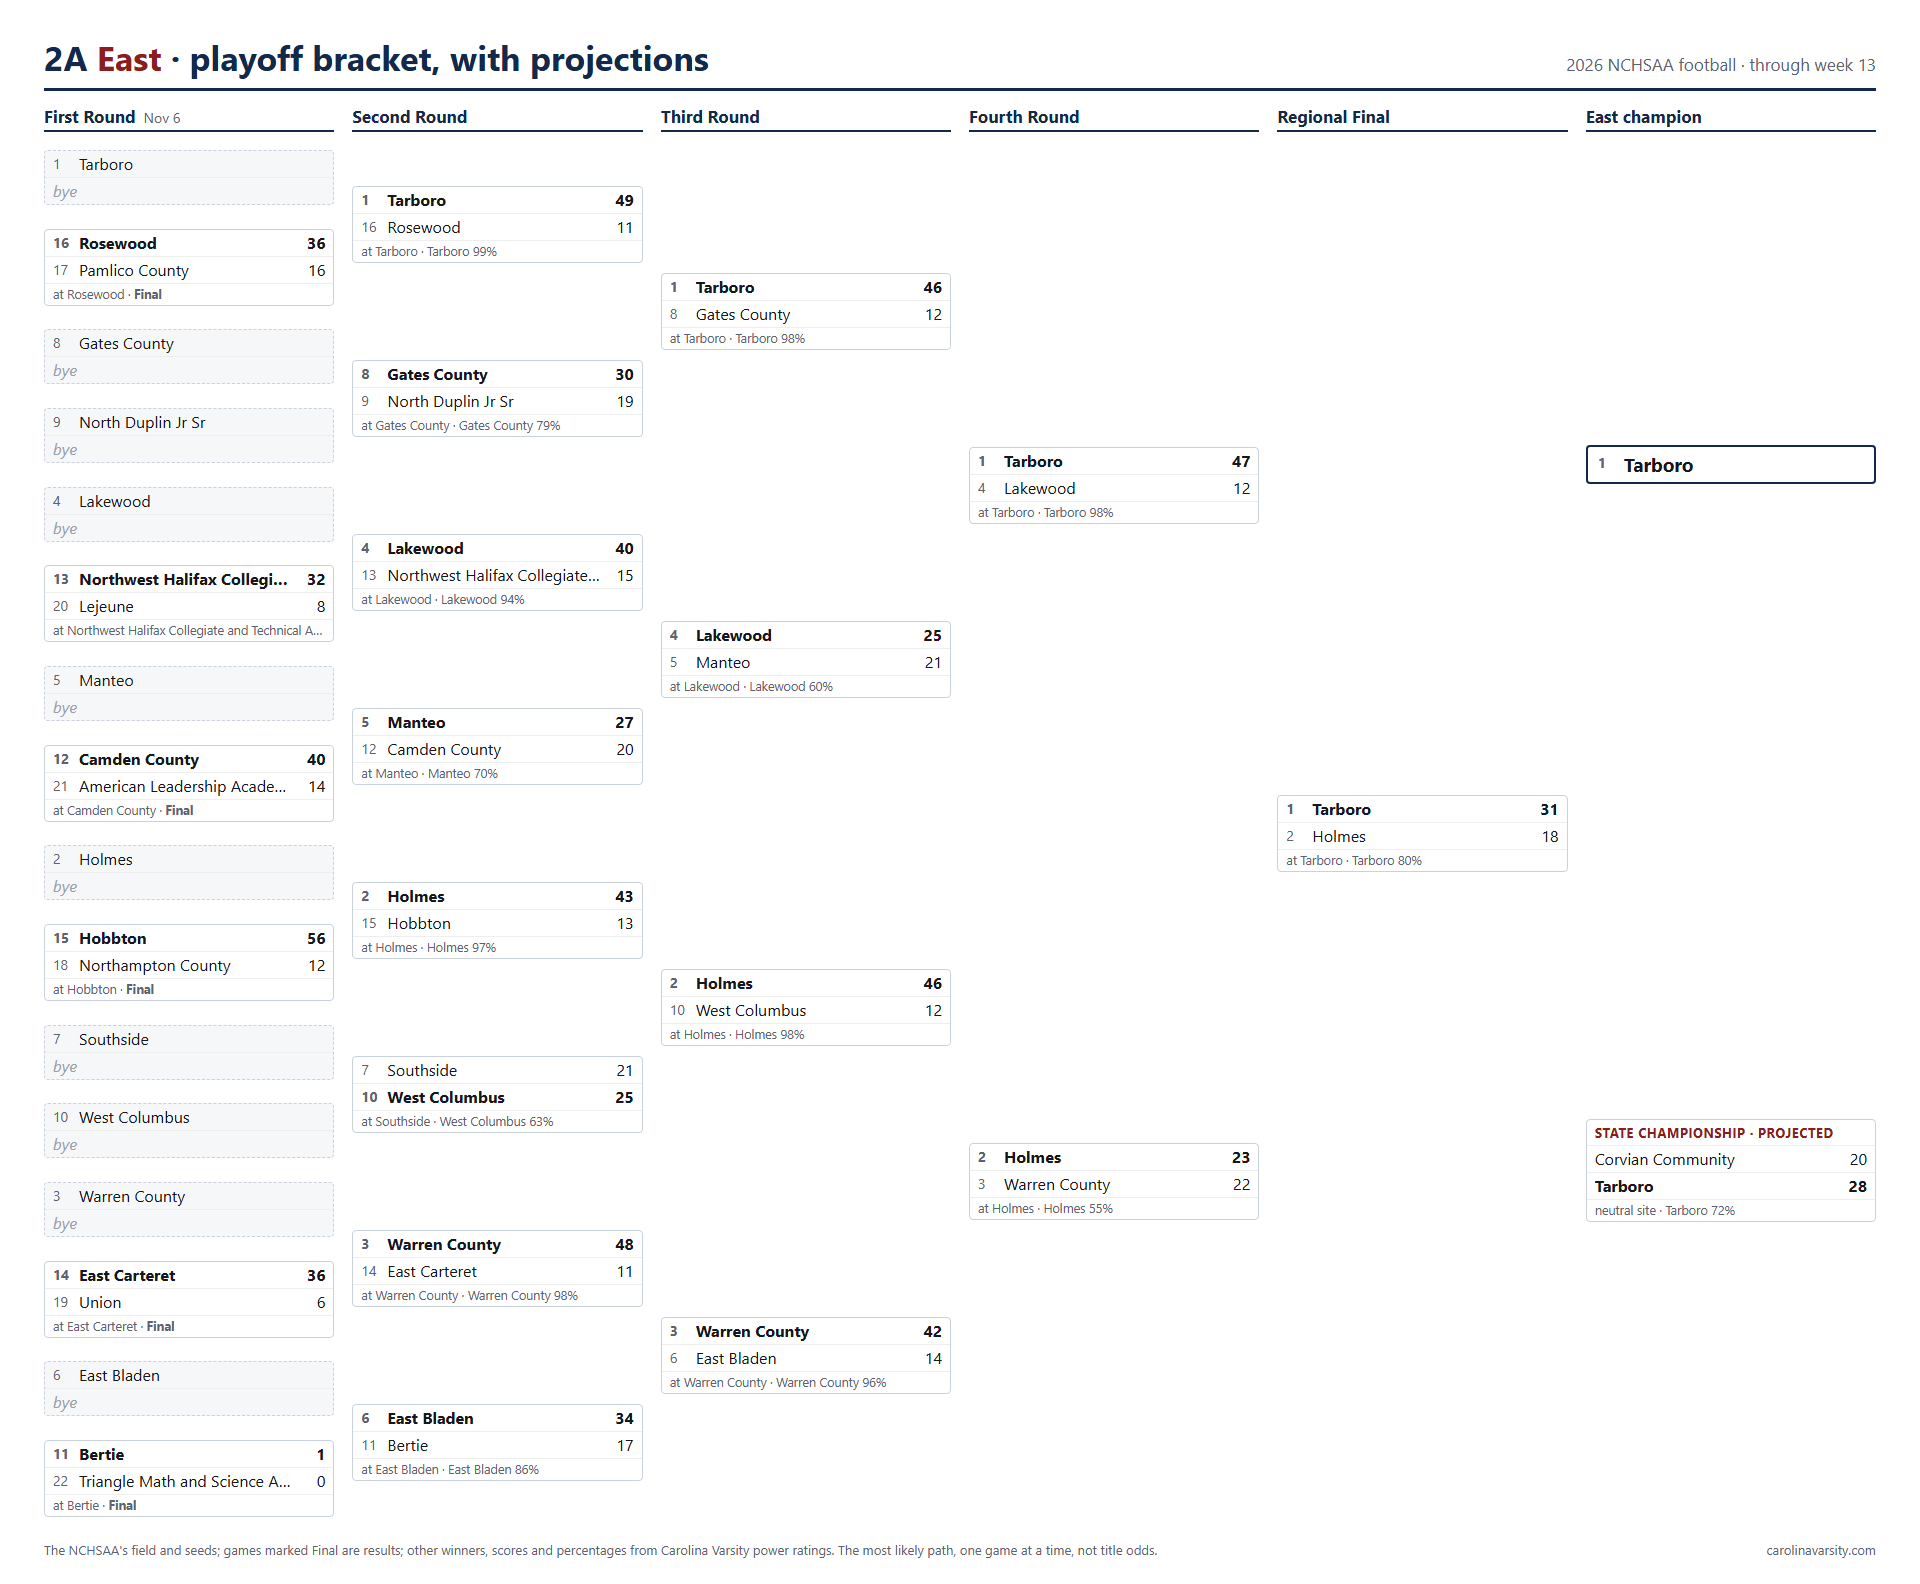
West and East for every classification: the NCHSAA's field and seeds, every game to the team our model favors with the score it predicts. All the brackets on one page.
The RPI bubble: the teams whose chance of making the playoffs is between 15% and 85%, with the last teams safely in and the first teams out on either edge, listed by that chance. In is 85% or better, Out below 15%.
8A bubble — 24 of 32 make the field
School
Record
Playoff chance
Status
RPI today
Rank today
Projected RPI
Edge of the bubble: last teams safely in
22
Wakefield
4-6-0
100%
In
0.47898
22
0.4687
23
South Mecklenburg
4-6-0
100%
In
0.47319
23
0.4586
24
Willow Spring
3-7-0
100%
In
0.44869
24
0.4405
Projected cut · top 24 make the field
Edge of the bubble: first teams out
25
Enloe
4-6-0
0%
Out
0.43711
25
0.4360
26
Northwest Guilford
2-8-0
0%
Out
0.41876
26
0.4211
27
Apex
3-7-0
0%
Out
0.41050
27
0.4082
24 of 32 8A teams make the field. Teams are listed by their chance of finishing in it, from the season simulation, which plays out the games each team has left; the dashed line is where the field is projected to be cut, and the bracket is drawn from the teams above it. RPI today and Rank today are the official NCHSAA table as it stands: the top 24 would make it if the season ended now. Projected RPI is the average final RPI across the simulated seasons. The order goes by playoff chance, which also counts how far a team's finish could swing either way, so two teams close in projected RPI can sit a place or two apart.
7A bubble — 48 of 60 make the field
School
Record
Playoff chance
Status
RPI today
Rank today
Projected RPI
Edge of the bubble: last teams safely in
46
Chapel Hill
3-7-0
100%
In
0.39384
47
0.3927
47
South Iredell
2-8-0
100%
In
0.39578
45
0.3895
48
North Mecklenburg
3-7-0
100%
In
0.38697
49
0.3857
Projected cut · top 48 make the field
Edge of the bubble: first teams out
49
Purnell Swett
3-7-0
0%
Out
0.37833
50
0.3849
50
East Wake
3-7-0
0%
Out
0.39215
48
0.3825
51
Southwest Guilford
2-8-0
0%
Out
0.37133
52
0.3751
48 of 60 7A teams make the field. Teams are listed by their chance of finishing in it, from the season simulation, which plays out the games each team has left; the dashed line is where the field is projected to be cut, and the bracket is drawn from the teams above it. RPI today and Rank today are the official NCHSAA table as it stands: the top 48 would make it if the season ended now. Projected RPI is the average final RPI across the simulated seasons. The order goes by playoff chance, which also counts how far a team's finish could swing either way, so two teams close in projected RPI can sit a place or two apart.
6A bubble — 48 of 58 make the field
School
Record
Playoff chance
Status
RPI today
Rank today
Projected RPI
Edge of the bubble: last teams safely in
46
South Caldwell
3-7-0
100%
In
0.42000
43
0.4132
47
Western Harnett
4-6-0
100%
In
0.41408
45
0.4128
48
West Brunswick
2-8-0
100%
In
0.40512
50
0.4121
Projected cut · top 48 make the field
Edge of the bubble: first teams out
49
Western Guilford
3-7-0
0%
Out
0.40596
49
0.4080
50
Saint Stephens
3-7-0
0%
Out
0.41200
47
0.4058
51
Southeast Guilford
3-7-0
0%
Out
0.39314
51
0.3977
48 of 58 6A teams make the field. Teams are listed by their chance of finishing in it, from the season simulation, which plays out the games each team has left; the dashed line is where the field is projected to be cut, and the bracket is drawn from the teams above it. RPI today and Rank today are the official NCHSAA table as it stands: the top 48 would make it if the season ended now. Projected RPI is the average final RPI across the simulated seasons. The order goes by playoff chance, which also counts how far a team's finish could swing either way, so two teams close in projected RPI can sit a place or two apart.
5A bubble — 48 of 57 make the field
School
Record
Playoff chance
Status
RPI today
Rank today
Projected RPI
Edge of the bubble: last teams safely in
46
Huss
3-7-0
100%
In
0.40898
46
0.4089
47
Richlands
2-8-0
100%
In
0.40205
47
0.4011
48
Charles B Aycock
2-8-0
100%
In
0.39617
48
0.3905
Projected cut · top 48 make the field
Edge of the bubble: first teams out
49
Dixon
2-8-0
0%
Out
0.36431
51
0.3761
50
Northeast Guilford
1-9-0
0%
Out
0.36144
52
0.3666
51
Atkins
2-8-0
0%
Out
0.36572
50
0.3640
48 of 57 5A teams make the field. Teams are listed by their chance of finishing in it, from the season simulation, which plays out the games each team has left; the dashed line is where the field is projected to be cut, and the bracket is drawn from the teams above it. RPI today and Rank today are the official NCHSAA table as it stands: the top 48 would make it if the season ended now. Projected RPI is the average final RPI across the simulated seasons. The order goes by playoff chance, which also counts how far a team's finish could swing either way, so two teams close in projected RPI can sit a place or two apart.
4A bubble — 48 of 55 make the field
School
Record
Playoff chance
Status
RPI today
Rank today
Projected RPI
Edge of the bubble: last teams safely in
46
Lincoln Charter
2-8-0
100%
In
0.39008
46
0.3917
47
Cummings
1-9-0
100%
In
0.39790
44
0.3876
48
Carver
3-7-0
100%
In
0.37006
48
0.3631
Projected cut · top 48 make the field
Edge of the bubble: first teams out
49
Ashe County
1-9-0
0%
Out
0.34647
50
0.3525
50
East Henderson
1-9-0
0%
Out
0.35089
49
0.3525
51
North Johnston
2-8-0
0%
Out
0.34154
51
0.3453
48 of 55 4A teams make the field. Teams are listed by their chance of finishing in it, from the season simulation, which plays out the games each team has left; the dashed line is where the field is projected to be cut, and the bracket is drawn from the teams above it. RPI today and Rank today are the official NCHSAA table as it stands: the top 48 would make it if the season ended now. Projected RPI is the average final RPI across the simulated seasons. The order goes by playoff chance, which also counts how far a team's finish could swing either way, so two teams close in projected RPI can sit a place or two apart.
3A bubble — 48 of 52 make the field
School
Record
Playoff chance
Status
RPI today
Rank today
Projected RPI
Edge of the bubble: last teams safely in
46
Patton
1-9-0
100%
In
0.32667
46
0.3327
47
Bessemer City
1-9-0
100%
In
0.32533
48
0.3310
48
Trinity
1-9-0
100%
In
0.30719
50
0.3078
Projected cut · top 48 make the field
Edge of the bubble: first teams out
49
Goldsboro
0-10-0
0%
Out
0.29021
52
0.2956
50
Bartlett Yancey
1-9-0
0%
Out
0.29315
51
0.2892
51
Beddingfield
0-10-0
0%
Out
0.26539
53
0.2661
48 of 52 3A teams make the field. Teams are listed by their chance of finishing in it, from the season simulation, which plays out the games each team has left; the dashed line is where the field is projected to be cut, and the bracket is drawn from the teams above it. RPI today and Rank today are the official NCHSAA table as it stands: the top 48 would make it if the season ended now. Projected RPI is the average final RPI across the simulated seasons. The order goes by playoff chance, which also counts how far a team's finish could swing either way, so two teams close in projected RPI can sit a place or two apart.
2A bubble — 48 of 44 make the field
All 44 2A teams make the 48-team field, so there is no bubble in 2A.
1A bubble — 48 of 22 make the field
All 22 1A teams make the 48-team field, so there is no bubble in 1A.
Winningest Coaches
North Carolina head-coaching records: every game in our archive for the seasons a coach is credited with, from HSFHA, the NCHSAA, NCHSFootball and MaxPreps, with a published stint filling a season no source names. Records outside North Carolina are HSFHA's. Still being completed: for 1980-1999 many seasons have no coach on record anywhere yet.
All-time, by NC wins
Coach
Schools
NC record
Pct
Seasons
State titles
Other states
Career
1
Jack Holley
Tabor City 1964-69, 1972-81; Hallsboro 1970-71; Wallace-Rose Hill 1982-92, 1997-2008; South Columbus 1993-96; Harrells Christian Academy 2009-10
417-126-8
.764
47
417-126-8
2
David Gentry
Edneyville 1974-83; Murphy 1984-2020
406-173-2
.701
47
9
406-173-2
3
Burton Cates
Eastern Randolph 1984-2009, 2012, 2018-26; Lee County 2010-11, 2013-14, 2016-17
Eastern Randolph 1984-2009, 2012, 2018-26; Lee County 2010-11, 2013-14, 2016-17
393-132
.749
42
1
393-132
2
Jeff Craddock
Tarboro 2004-26
265-48
.847
23
9
265-48
3
Steve Davis
Dudley 2004-26
252-61
.805
23
5
252-61
4
Richard Bailey
Jack Britt 2000-02, 2004, 2006-10; Scotland 2012-26
241-76
.760
24
241-76
5
Antonio Moore
Northeastern 2005-26
238-58
.804
22
238-58
6
Donnie Kiefer
Saint Pauls 1986-87; Southwest Guilford 1988-90; Gates County 1991-93; Andrews 1994-95; Hibriten 1996-98; Roanoke 1999-2003; East Carteret 2004-06; Tuscola 2007-11; Central Cabarrus 2012-16, 2022, 2025-26
120 simulated seasons. Results through week 12 are taken as they stand; every week after that is played out in full, with ratings refit after each one. Outcomes are sampled rather than awarded to the favorite, so upsets happen at the rate the model believes they happen. The mean rating comes back close to where the season has already put each team — a simulation learns nothing new about games nobody has played — so the 10th–90th band, not the mean, is the forecast, and it widens the further out the projection runs.