2026 NCHSAA Football Playoffs, with Projections
Week 13. The field and seeds are the NCHSAA's, from its final RPI table, and the bracket is the most likely path through it. Every game goes to the team our model favors, with the score it predicts. The title odds beside it come from playing the rest of the season and the playoffs 120 times, upsets included — a 60% favorite wins this bracket every time and the title 60% of the time. Field sizes and seeding follow the NCHSAA handbook: 48 teams in 1A-7A and 24 in 8A, split east and west by longitude, the higher seed hosting through the regional final and the final at a neutral site.
8A
Projected champion: Hough · wins the title in 57% of simulated seasons
RPI bubble
| School | Record | Playoff chance | Status | RPI today | Rank today | Projected RPI | |
|---|---|---|---|---|---|---|---|
| Edge of the bubble: last teams safely in | |||||||
| 22 | Wakefield | 4-6-0 | 100% | In | 0.47898 | 22 | 0.4687 |
| 23 | South Mecklenburg | 4-6-0 | 100% | In | 0.47319 | 23 | 0.4586 |
| 24 | Willow Spring | 3-7-0 | 100% | In | 0.44869 | 24 | 0.4405 |
| Projected cut · top 24 make the field | |||||||
| Edge of the bubble: first teams out | |||||||
| 25 | Enloe | 4-6-0 | 0% | Out | 0.43711 | 25 | 0.4360 |
| 26 | Northwest Guilford | 2-8-0 | 0% | Out | 0.41876 | 26 | 0.4211 |
| 27 | Apex | 3-7-0 | 0% | Out | 0.41050 | 27 | 0.4082 |
24 of 32 8A teams make the field. Teams are listed by their chance of finishing in it, from the season simulation, which plays out the games each team has left; the dashed line is where the field is projected to be cut, and the bracket is drawn from the teams above it. RPI today and Rank today are the official NCHSAA table as it stands: the top 24 would make it if the season ended now. Projected RPI is the average final RPI across the simulated seasons. The order goes by playoff chance, which also counts how far a team's finish could swing either way, so two teams close in projected RPI can sit a place or two apart.
Bracket, with projections
24 teams, 16-team bracket per region, the NCHSAA's field and seeds. 8 games played, marked Final; every other game goes to the team our model favors, with the score it predicts.


East
First Round
Byes: seeds 1-4
Second Round
Third Round
Regional Final
West
First Round
Byes: seeds 1-4
Second Round
Third Round
Regional Final
State Championship
Every 8A team's projection — 32 teams
| School | Proj. record | Playoffs | Avg seed | Title |
|---|---|---|---|---|
| Hough | 10.0-0.0 | 100% | 1.0 | 56.7% |
| Chambers | 9.0-1.0 | 100% | 2.0 | 1.7% |
| Millbrook | 9.0-0.0 | 100% | 1.0 | 20.8% |
| Mallard Creek | 8.0-2.0 | 100% | 3.0 | 2.5% |
| Hoggard | 9.0-1.0 | 100% | 2.0 | 6.7% |
| Apex Friendship | 10.0-0.0 | 100% | 3.0 | 0.0% |
| West Forsyth | 8.0-2.0 | 100% | 4.0 | 2.5% |
| Pinecrest | 8.0-3.0 | 100% | 5.0 | 0.0% |
| Rolesville | 7.0-2.0 | 100% | 4.0 | 9.2% |
| Myers Park | 8.0-3.0 | 100% | 6.0 | 0.0% |
| West Charlotte | 7.0-4.0 | 100% | 7.0 | 0.0% |
| Palisades | 9.0-2.0 | 100% | 8.0 | 0.0% |
| Green Hope | 9.0-2.0 | 100% | 5.0 | 0.0% |
| Jordan | 8.0-3.0 | 100% | 6.0 | 0.0% |
| Laney | 6.0-5.0 | 100% | 7.0 | 0.0% |
| Leesville Road | 7.0-4.0 | 100% | 8.0 | 0.0% |
| Ardrey Kell | 7.0-4.0 | 100% | 9.0 | 0.0% |
| Panther Creek | 6.0-5.0 | 100% | 9.0 | 0.0% |
| Hoke County | 5.0-6.0 | 100% | 10.0 | 0.0% |
| Providence | 5.0-6.0 | 100% | 11.0 | 0.0% |
| Broughton | 5.0-6.0 | 100% | 10.0 | 0.0% |
| Wakefield | 4.0-7.0 | 100% | 11.0 | 0.0% |
| South Mecklenburg | 4.0-7.0 | 100% | 12.0 | 0.0% |
| Willow Spring | 3.0-8.0 | 100% | 12.0 | 0.0% |
| Enloe | 4.0-6.0 | 0% | — | 0.0% |
| Northwest Guilford | 2.0-8.0 | 0% | — | 0.0% |
| Apex | 3.0-7.0 | 0% | — | 0.0% |
| Corinth Holders | 2.0-8.0 | 0% | — | 0.0% |
| East Mecklenburg | 4.0-6.0 | 0% | — | 0.0% |
| Athens Drive | 2.0-8.0 | 0% | — | 0.0% |
| Garinger | 2.0-8.0 | 0% | — | 0.0% |
| Green Level | 1.0-9.0 | 0% | — | 0.0% |
7A
Projected champion: Weddington · wins the title in 32% of simulated seasons
RPI bubble
| School | Record | Playoff chance | Status | RPI today | Rank today | Projected RPI | |
|---|---|---|---|---|---|---|---|
| Edge of the bubble: last teams safely in | |||||||
| 46 | Chapel Hill | 3-7-0 | 100% | In | 0.39384 | 47 | 0.3927 |
| 47 | South Iredell | 2-8-0 | 100% | In | 0.39578 | 45 | 0.3895 |
| 48 | North Mecklenburg | 3-7-0 | 100% | In | 0.38697 | 49 | 0.3857 |
| Projected cut · top 48 make the field | |||||||
| Edge of the bubble: first teams out | |||||||
| 49 | Purnell Swett | 3-7-0 | 0% | Out | 0.37833 | 50 | 0.3849 |
| 50 | East Wake | 3-7-0 | 0% | Out | 0.39215 | 48 | 0.3825 |
| 51 | Southwest Guilford | 2-8-0 | 0% | Out | 0.37133 | 52 | 0.3751 |
48 of 60 7A teams make the field. Teams are listed by their chance of finishing in it, from the season simulation, which plays out the games each team has left; the dashed line is where the field is projected to be cut, and the bracket is drawn from the teams above it. RPI today and Rank today are the official NCHSAA table as it stands: the top 48 would make it if the season ended now. Projected RPI is the average final RPI across the simulated seasons. The order goes by playoff chance, which also counts how far a team's finish could swing either way, so two teams close in projected RPI can sit a place or two apart.
Bracket, with projections
48 teams, 32-team bracket per region, the NCHSAA's field and seeds. 16 games played, marked Final; every other game goes to the team our model favors, with the score it predicts.


East
First Round
Byes: seeds 1-8
Second Round
Third Round
Fourth Round
Regional Final
West
First Round
Byes: seeds 1-8
Second Round
Third Round
Fourth Round
Regional Final
State Championship
Every 7A team's projection — 60 teams
| School | Proj. record | Playoffs | Avg seed | Title |
|---|---|---|---|---|
| Weddington | 10.0-0.0 | 100% | 1.0 | 32.5% |
| Grimsley | 10.0-0.0 | 100% | 2.0 | 16.7% |
| Cleveland | 9.0-1.0 | 100% | 1.0 | 19.2% |
| Lake Norman | 10.0-0.0 | 100% | 3.0 | 10.8% |
| Garner | 8.0-2.0 | 100% | 2.0 | 5.0% |
| Reagan | 8.0-2.0 | 100% | 4.0 | 7.5% |
| A L Brown | 10.0-0.0 | 100% | 5.0 | 0.0% |
| Marvin Ridge | 9.0-1.0 | 100% | 6.0 | 0.0% |
| Clayton | 8.0-2.0 | 100% | 3.0 | 4.2% |
| New Bern | 7.0-3.0 | 100% | 4.0 | 0.0% |
| Southern School of Energy and Sustainability | 9.0-1.0 | 100% | 5.0 | 1.7% |
| Cardinal Gibbons | 7.0-3.0 | 100% | 6.0 | 0.8% |
| Wake Forest | 8.0-2.0 | 100% | 7.0 | 0.8% |
| Page | 9.0-1.0 | 100% | 7.0 | 0.8% |
| East Forsyth | 7.0-3.0 | 100% | 8.0 | 0.0% |
| Cape Fear | 8.0-2.0 | 100% | 8.0 | 0.0% |
| D H Conley | 7.0-4.0 | 100% | 9.0 | 0.0% |
| Southeast Raleigh | 8.0-3.0 | 100% | 10.0 | 0.0% |
| Hickory Ridge | 9.0-2.0 | 100% | 9.0 | 0.0% |
| Davie County | 7.0-4.0 | 100% | 10.0 | 0.0% |
| Mooresville | 6.0-5.0 | 100% | 11.0 | 0.0% |
| Ashley | 7.0-4.0 | 100% | 11.0 | 0.0% |
| West Cabarrus | 6.0-5.0 | 100% | 12.0 | 0.0% |
| Hillside | 7.0-4.0 | 100% | 12.0 | 0.0% |
| Jack Britt | 6.0-5.0 | 100% | 13.0 | 0.0% |
| Holly Springs | 6.0-5.0 | 100% | 13.0 | 0.0% |
| Topsail | 5.0-6.0 | 100% | 14.0 | 0.0% |
| Richmond | 5.0-6.0 | 100% | 14.0 | 0.0% |
| North Brunswick | 6.0-5.0 | 100% | 15.0 | 0.0% |
| Butler | 5.0-6.0 | 100% | 15.0 | 0.0% |
| South Central | 4.0-7.0 | 100% | 16.0 | 0.0% |
| Heritage | 5.0-6.0 | 100% | 17.0 | 0.0% |
| Sanderson | 6.0-5.0 | 100% | 18.0 | 0.0% |
| Porter Ridge | 4.0-7.0 | 100% | 16.0 | 0.0% |
| Fuquay-Varina | 4.0-7.0 | 100% | 19.0 | 0.0% |
| South Garner | 4.0-7.0 | 100% | 20.0 | 0.0% |
| Hopewell | 5.0-6.0 | 100% | 17.0 | 0.0% |
| Overhills | 4.0-7.0 | 100% | 21.0 | 0.0% |
| Independence | 2.0-9.0 | 100% | 18.0 | 0.0% |
| Pine Forest | 3.0-8.0 | 100% | 22.0 | 0.0% |
| New Hanover | 2.0-9.0 | 100% | 23.0 | 0.0% |
| R J Reynolds | 4.0-7.0 | 100% | 19.0 | 0.0% |
| Ballantyne Ridge | 4.0-7.0 | 100% | 20.0 | 0.0% |
| Lumberton | 2.0-9.0 | 100% | 24.0 | 0.0% |
| Parkland | 3.0-8.0 | 100% | 21.0 | 0.0% |
| Chapel Hill | 3.0-8.0 | 100% | 22.0 | 0.0% |
| South Iredell | 2.0-9.0 | 100% | 23.0 | 0.0% |
| North Mecklenburg | 3.0-7.0 | 100% | 24.0 | 0.0% |
| Purnell Swett | 3.0-7.0 | 0% | — | 0.0% |
| East Wake | 3.0-8.0 | 0% | — | 0.0% |
| Southwest Guilford | 2.0-8.0 | 0% | — | 0.0% |
| Cary | 3.0-7.0 | 0% | — | 0.0% |
| Cuthbertson | 1.0-9.0 | 0% | — | 0.0% |
| West Mecklenburg | 2.0-8.0 | 0% | — | 0.0% |
| Riverside | 2.0-8.0 | 0% | — | 0.0% |
| Cox Mill | 2.0-8.0 | 0% | — | 0.0% |
| McDowell | 1.0-9.0 | 0% | — | 0.0% |
| Smithfield-Selma | 0.0-10.0 | 0% | — | 0.0% |
| Knightdale | 1.0-9.0 | 0% | — | 0.0% |
| Rocky River | 0.0-10.0 | 0% | — | 0.0% |
6A
Projected champion: Junius H Rose · wins the title in 44% of simulated seasons
RPI bubble
| School | Record | Playoff chance | Status | RPI today | Rank today | Projected RPI | |
|---|---|---|---|---|---|---|---|
| Edge of the bubble: last teams safely in | |||||||
| 46 | South Caldwell | 3-7-0 | 100% | In | 0.42000 | 43 | 0.4132 |
| 47 | Western Harnett | 4-6-0 | 100% | In | 0.41408 | 45 | 0.4128 |
| 48 | West Brunswick | 2-8-0 | 100% | In | 0.40512 | 50 | 0.4121 |
| Projected cut · top 48 make the field | |||||||
| Edge of the bubble: first teams out | |||||||
| 49 | Western Guilford | 3-7-0 | 0% | Out | 0.40596 | 49 | 0.4080 |
| 50 | Saint Stephens | 3-7-0 | 0% | Out | 0.41200 | 47 | 0.4058 |
| 51 | Southeast Guilford | 3-7-0 | 0% | Out | 0.39314 | 51 | 0.3977 |
48 of 58 6A teams make the field. Teams are listed by their chance of finishing in it, from the season simulation, which plays out the games each team has left; the dashed line is where the field is projected to be cut, and the bracket is drawn from the teams above it. RPI today and Rank today are the official NCHSAA table as it stands: the top 48 would make it if the season ended now. Projected RPI is the average final RPI across the simulated seasons. The order goes by playoff chance, which also counts how far a team's finish could swing either way, so two teams close in projected RPI can sit a place or two apart.
Bracket, with projections
48 teams, 32-team bracket per region, the NCHSAA's field and seeds. 16 games played, marked Final; every other game goes to the team our model favors, with the score it predicts.


East
First Round
Byes: seeds 1-8
Second Round
Third Round
Fourth Round
Regional Final
West
First Round
Byes: seeds 1-8
Second Round
Third Round
Fourth Round
Regional Final
State Championship
Every 6A team's projection — 58 teams
| School | Proj. record | Playoffs | Avg seed | Title |
|---|---|---|---|---|
| Junius H Rose | 10.0-0.0 | 100% | 1.0 | 44.2% |
| Asheville | 9.0-1.0 | 100% | 1.0 | 0.8% |
| Jacksonville | 7.0-2.0 | 100% | 2.0 | 15.0% |
| Scotland | 9.0-1.0 | 100% | 2.0 | 15.8% |
| Northern Nash | 8.0-2.0 | 100% | 3.0 | 10.0% |
| Union Pines | 9.0-1.0 | 100% | 4.0 | 0.8% |
| Southern Alamance | 8.0-2.0 | 100% | 5.0 | 0.0% |
| Roberson | 8.0-2.0 | 100% | 3.0 | 2.5% |
| Williams | 6.0-2.0 | 100% | 6.0 | 0.0% |
| Asheboro | 9.0-1.0 | 100% | 4.0 | 0.0% |
| Middle Creek | 8.0-2.0 | 100% | 7.0 | 5.0% |
| Seventy-First | 10.0-1.0 | 100% | 8.0 | 2.5% |
| Triton | 10.0-1.0 | 100% | 9.0 | 0.0% |
| Kings Mountain | 7.0-3.0 | 100% | 5.0 | 3.3% |
| Harnett Central | 9.0-2.0 | 100% | 10.0 | 0.0% |
| Mount Tabor | 6.0-4.0 | 100% | 6.0 | 0.0% |
| Swansboro | 8.0-3.0 | 100% | 11.0 | 0.0% |
| Freedom | 8.0-2.0 | 100% | 7.0 | 0.0% |
| Alexander Central | 8.0-2.0 | 100% | 8.0 | 0.0% |
| Sun Valley | 6.0-5.0 | 100% | 9.0 | 0.0% |
| Northern Guilford | 7.0-4.0 | 100% | 10.0 | 0.0% |
| Charlotte Catholic | 7.0-4.0 | 100% | 11.0 | 0.0% |
| Dudley | 6.0-4.0 | 100% | 12.0 | 0.0% |
| Westover | 7.0-4.0 | 100% | 12.0 | 0.0% |
| Franklinton | 8.0-3.0 | 100% | 13.0 | 0.0% |
| Ashbrook | 6.0-5.0 | 100% | 13.0 | 0.0% |
| Watauga | 6.0-5.0 | 100% | 14.0 | 0.0% |
| Ragsdale | 6.0-5.0 | 100% | 15.0 | 0.0% |
| Gray's Creek | 7.0-4.0 | 100% | 14.0 | 0.0% |
| Reynolds | 4.0-7.0 | 100% | 16.0 | 0.0% |
| Glenn | 6.0-5.0 | 100% | 17.0 | 0.0% |
| Eastern Guilford | 4.0-6.0 | 100% | 18.0 | 0.0% |
| South Johnston | 5.0-6.0 | 100% | 15.0 | 0.0% |
| Terry Sanford | 4.0-7.0 | 100% | 16.0 | 0.0% |
| Statesville | 4.0-7.0 | 100% | 19.0 | 0.0% |
| Felton Grove | 4.0-7.0 | 100% | 17.0 | 0.0% |
| Phillip O Berry Academy of Technology | 5.0-6.0 | 100% | 20.0 | 0.0% |
| Northern | 5.0-6.0 | 100% | 18.0 | 0.0% |
| West Johnston | 4.0-7.0 | 100% | 19.0 | 0.0% |
| Olympic | 4.0-7.0 | 100% | 21.0 | 0.0% |
| Piedmont | 3.0-8.0 | 100% | 22.0 | 0.0% |
| South View | 3.0-8.0 | 100% | 20.0 | 0.0% |
| White Oak | 2.0-8.0 | 100% | 21.0 | 0.0% |
| Central Cabarrus | 3.0-8.0 | 100% | 23.0 | 0.0% |
| Lee County | 2.0-9.0 | 100% | 22.0 | 0.0% |
| South Caldwell | 3.0-8.0 | 100% | 24.0 | 0.0% |
| Western Harnett | 4.0-7.0 | 100% | 23.0 | 0.0% |
| West Brunswick | 2.0-8.0 | 100% | 24.0 | 0.0% |
| Western Guilford | 3.0-7.0 | 0% | — | 0.0% |
| Saint Stephens | 3.0-8.0 | 0% | — | 0.0% |
| Southeast Guilford | 3.0-7.0 | 0% | — | 0.0% |
| Vance County | 1.0-9.0 | 0% | — | 0.0% |
| E E Smith | 2.0-8.0 | 0% | — | 0.0% |
| Harding University | 2.0-8.0 | 0% | — | 0.0% |
| Ben L. Smith | 1.0-9.0 | 0% | — | 0.0% |
| Southern Lee | 0.0-10.0 | 0% | — | 0.0% |
| North Iredell | 0.0-10.0 | 0% | — | 0.0% |
| East Chapel Hill | 1.0-8.0 | 0% | — | 0.0% |
5A
Projected champion: Crest · wins the title in 9% of simulated seasons
RPI bubble
| School | Record | Playoff chance | Status | RPI today | Rank today | Projected RPI | |
|---|---|---|---|---|---|---|---|
| Edge of the bubble: last teams safely in | |||||||
| 46 | Huss | 3-7-0 | 100% | In | 0.40898 | 46 | 0.4089 |
| 47 | Richlands | 2-8-0 | 100% | In | 0.40205 | 47 | 0.4011 |
| 48 | Charles B Aycock | 2-8-0 | 100% | In | 0.39617 | 48 | 0.3905 |
| Projected cut · top 48 make the field | |||||||
| Edge of the bubble: first teams out | |||||||
| 49 | Dixon | 2-8-0 | 0% | Out | 0.36431 | 51 | 0.3761 |
| 50 | Northeast Guilford | 1-9-0 | 0% | Out | 0.36144 | 52 | 0.3666 |
| 51 | Atkins | 2-8-0 | 0% | Out | 0.36572 | 50 | 0.3640 |
48 of 57 5A teams make the field. Teams are listed by their chance of finishing in it, from the season simulation, which plays out the games each team has left; the dashed line is where the field is projected to be cut, and the bracket is drawn from the teams above it. RPI today and Rank today are the official NCHSAA table as it stands: the top 48 would make it if the season ended now. Projected RPI is the average final RPI across the simulated seasons. The order goes by playoff chance, which also counts how far a team's finish could swing either way, so two teams close in projected RPI can sit a place or two apart.
Bracket, with projections
48 teams, 32-team bracket per region, the NCHSAA's field and seeds. 16 games played, marked Final; every other game goes to the team our model favors, with the score it predicts.


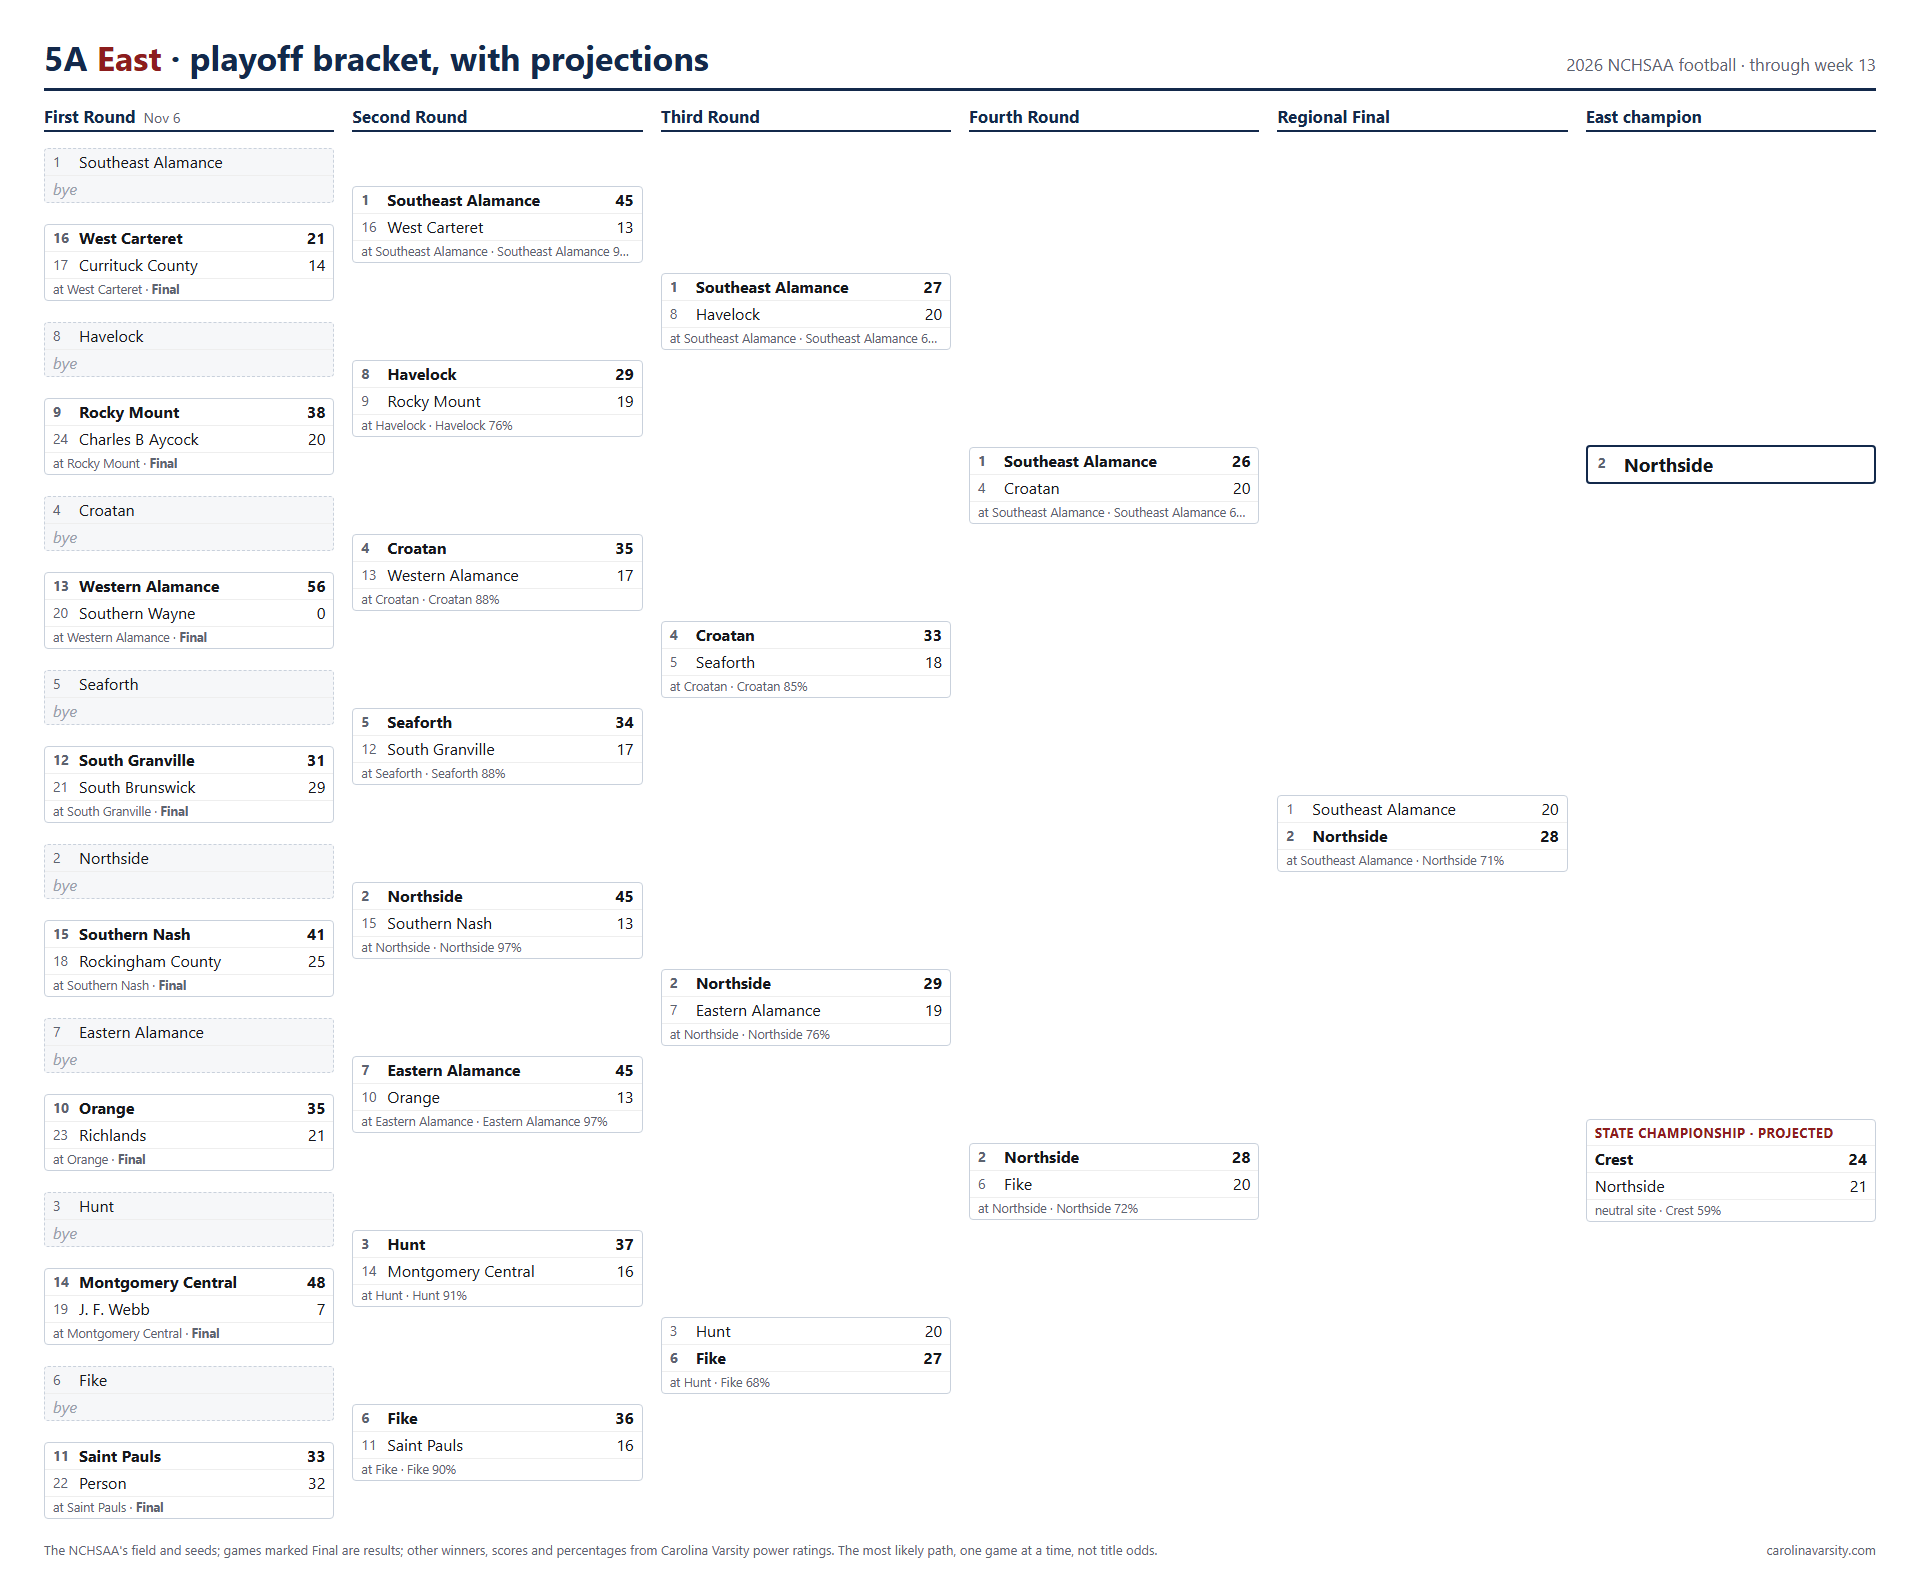
East
First Round
Byes: seeds 1-8
Second Round
Third Round
Fourth Round
Regional Final
West
First Round
Byes: seeds 1-8
Second Round
Third Round
Fourth Round
Regional Final
State Championship
Every 5A team's projection — 57 teams
| School | Proj. record | Playoffs | Avg seed | Title |
|---|---|---|---|---|
| Southeast Alamance | 10.0-0.0 | 100% | 1.0 | 15.0% |
| Crest | 9.0-1.0 | 100% | 1.0 | 9.2% |
| Northside | 10.0-0.0 | 100% | 2.0 | 25.0% |
| Franklin | 10.0-0.0 | 100% | 2.0 | 0.0% |
| South Point | 9.0-1.0 | 100% | 3.0 | 13.3% |
| Hunt | 9.0-1.0 | 100% | 3.0 | 0.8% |
| Jay M Robinson | 10.0-0.0 | 100% | 4.0 | 6.7% |
| Monroe | 8.0-2.0 | 100% | 5.0 | 5.8% |
| Croatan | 9.0-1.0 | 100% | 4.0 | 2.5% |
| East Lincoln | 9.0-1.0 | 100% | 6.0 | 5.8% |
| West Rowan | 8.0-2.0 | 100% | 7.0 | 0.0% |
| Seaforth | 9.0-1.0 | 100% | 5.0 | 0.0% |
| Oak Grove | 8.0-2.0 | 100% | 8.0 | 4.2% |
| Hickory | 8.0-3.0 | 100% | 9.0 | 1.7% |
| Forest Hills | 9.0-2.0 | 100% | 10.0 | 0.0% |
| Fike | 8.0-2.0 | 100% | 6.0 | 5.0% |
| Eastern Alamance | 7.0-2.0 | 100% | 7.0 | 5.0% |
| Enka | 9.0-2.0 | 100% | 11.0 | 0.0% |
| Smoky Mountain | 9.0-2.0 | 100% | 12.0 | 0.0% |
| Havelock | 5.0-5.0 | 100% | 8.0 | 0.0% |
| North Davidson | 8.0-3.0 | 100% | 13.0 | 0.0% |
| Rocky Mount | 7.0-4.0 | 100% | 9.0 | 0.0% |
| Northwest Cabarrus | 7.0-4.0 | 100% | 14.0 | 0.0% |
| Parkwood | 6.0-5.0 | 100% | 15.0 | 0.0% |
| Orange | 7.0-4.0 | 100% | 10.0 | 0.0% |
| Saint Pauls | 8.0-3.0 | 100% | 11.0 | 0.0% |
| West Henderson | 6.0-5.0 | 100% | 16.0 | 0.0% |
| Montgomery Central | 6.0-5.0 | 100% | 12.0 | 0.0% |
| South Granville | 7.0-4.0 | 100% | 13.0 | 0.0% |
| Western Alamance | 6.0-5.0 | 100% | 14.0 | 0.0% |
| West Carteret | 5.0-6.0 | 100% | 15.0 | 0.0% |
| Southern Nash | 5.0-6.0 | 100% | 16.0 | 0.0% |
| Erwin | 4.0-7.0 | 100% | 17.0 | 0.0% |
| North Lincoln | 4.0-7.0 | 100% | 18.0 | 0.0% |
| Carson | 4.0-7.0 | 100% | 19.0 | 0.0% |
| Currituck County | 4.0-7.0 | 100% | 17.0 | 0.0% |
| Rockingham County | 4.0-7.0 | 100% | 18.2 | 0.0% |
| South Brunswick | 5.0-6.0 | 100% | 18.8 | 0.0% |
| J. F. Webb | 4.0-7.0 | 100% | 20.0 | 0.0% |
| Southern Wayne | 4.0-7.0 | 100% | 21.0 | 0.0% |
| North Buncombe | 4.0-7.0 | 100% | 20.0 | 0.0% |
| East Rowan | 4.0-7.0 | 100% | 21.0 | 0.0% |
| North Henderson | 2.0-9.0 | 100% | 22.0 | 0.0% |
| Forestview | 2.0-9.0 | 100% | 23.0 | 0.0% |
| Person | 2.0-9.0 | 100% | 22.0 | 0.0% |
| Huss | 3.0-8.0 | 100% | 24.0 | 0.0% |
| Richlands | 2.0-9.0 | 100% | 23.0 | 0.0% |
| Charles B Aycock | 2.0-9.0 | 100% | 24.0 | 0.0% |
| Dixon | 2.0-8.0 | 0% | — | 0.0% |
| Northeast Guilford | 1.0-9.0 | 0% | — | 0.0% |
| Atkins | 2.0-8.0 | 0% | — | 0.0% |
| Concord | 1.0-9.0 | 0% | — | 0.0% |
| North Forsyth Magnet | 1.0-9.0 | 0% | — | 0.0% |
| Southern Guilford | 1.0-9.0 | 0% | — | 0.0% |
| North Gaston | 0.0-10.0 | 0% | — | 0.0% |
| Cedar Ridge | 1.0-7.0 | 0% | — | 0.0% |
| Douglas Byrd | 0.0-10.0 | 0% | — | 0.0% |
4A
Projected champion: Hibriten · wins the title in 12% of simulated seasons
RPI bubble
| School | Record | Playoff chance | Status | RPI today | Rank today | Projected RPI | |
|---|---|---|---|---|---|---|---|
| Edge of the bubble: last teams safely in | |||||||
| 46 | Lincoln Charter | 2-8-0 | 100% | In | 0.39008 | 46 | 0.3917 |
| 47 | Cummings | 1-9-0 | 100% | In | 0.39790 | 44 | 0.3876 |
| 48 | Carver | 3-7-0 | 100% | In | 0.37006 | 48 | 0.3631 |
| Projected cut · top 48 make the field | |||||||
| Edge of the bubble: first teams out | |||||||
| 49 | Ashe County | 1-9-0 | 0% | Out | 0.34647 | 50 | 0.3525 |
| 50 | East Henderson | 1-9-0 | 0% | Out | 0.35089 | 49 | 0.3525 |
| 51 | North Johnston | 2-8-0 | 0% | Out | 0.34154 | 51 | 0.3453 |
48 of 55 4A teams make the field. Teams are listed by their chance of finishing in it, from the season simulation, which plays out the games each team has left; the dashed line is where the field is projected to be cut, and the bracket is drawn from the teams above it. RPI today and Rank today are the official NCHSAA table as it stands: the top 48 would make it if the season ended now. Projected RPI is the average final RPI across the simulated seasons. The order goes by playoff chance, which also counts how far a team's finish could swing either way, so two teams close in projected RPI can sit a place or two apart.
Bracket, with projections
48 teams, 32-team bracket per region, the NCHSAA's field and seeds. 16 games played, marked Final; every other game goes to the team our model favors, with the score it predicts.


East
First Round
Byes: seeds 1-8
Second Round
Third Round
Fourth Round
Regional Final
West
First Round
Byes: seeds 1-8
Second Round
Third Round
Fourth Round
Regional Final
State Championship
Every 4A team's projection — 55 teams
| School | Proj. record | Playoffs | Avg seed | Title |
|---|---|---|---|---|
| East Duplin | 9.0-1.0 | 100% | 1.0 | 3.3% |
| West Iredell | 9.0-1.0 | 100% | 1.0 | 15.0% |
| Hibriten | 10.0-0.0 | 100% | 2.0 | 11.7% |
| Tuscola | 9.0-1.0 | 100% | 3.0 | 11.7% |
| T Wingate Andrews | 9.0-1.0 | 100% | 2.0 | 25.0% |
| Clinton | 7.0-3.0 | 100% | 3.0 | 0.8% |
| West Craven | 8.0-2.0 | 100% | 4.0 | 1.7% |
| Mount Pleasant | 7.0-3.0 | 100% | 4.0 | 0.0% |
| Burns | 7.0-3.0 | 100% | 5.0 | 10.0% |
| West Stokes | 8.0-2.0 | 100% | 6.0 | 1.7% |
| Reidsville | 7.0-3.0 | 100% | 5.0 | 7.5% |
| SouthWest Edgecombe | 7.0-3.0 | 100% | 6.0 | 3.3% |
| Stuart W Cramer | 8.0-2.0 | 100% | 7.0 | 7.5% |
| Lake Norman Charter | 7.0-3.0 | 100% | 8.0 | 0.0% |
| R-S Central | 8.0-3.0 | 100% | 9.0 | 0.0% |
| Bunker Hill | 7.0-4.0 | 100% | 10.0 | 0.0% |
| Wilkes Central | 8.0-3.0 | 100% | 11.0 | 0.0% |
| Maiden | 6.0-5.0 | 100% | 12.0 | 0.0% |
| West Stanly | 5.0-6.0 | 100% | 13.0 | 0.0% |
| South Rowan | 7.0-4.0 | 100% | 14.0 | 0.0% |
| East Burke | 6.0-5.0 | 100% | 15.0 | 0.0% |
| Pisgah | 6.0-5.0 | 100% | 16.0 | 0.0% |
| Morehead | 7.0-3.0 | 100% | 7.0 | 0.0% |
| Fairmont | 6.0-5.0 | 100% | 8.0 | 0.0% |
| Southwestern Randolph | 7.0-3.0 | 100% | 9.0 | 0.0% |
| Ledford | 5.0-6.0 | 100% | 10.0 | 0.8% |
| Randleman | 5.0-6.0 | 100% | 11.0 | 0.0% |
| North Surry | 5.0-6.0 | 100% | 17.0 | 0.0% |
| Washington | 4.0-7.0 | 100% | 12.0 | 0.0% |
| Anson | 5.0-6.0 | 100% | 13.0 | 0.0% |
| Newton-Conover | 4.0-7.0 | 100% | 18.0 | 0.0% |
| Nash Central | 4.0-7.0 | 100% | 14.0 | 0.0% |
| Southwest | 5.0-6.0 | 100% | 15.0 | 0.0% |
| East Gaston | 5.0-6.0 | 100% | 19.0 | 0.0% |
| Roanoke Rapids | 5.0-6.0 | 100% | 16.0 | 0.0% |
| North Pitt | 5.0-6.0 | 100% | 17.0 | 0.0% |
| Salisbury | 3.0-8.0 | 100% | 20.0 | 0.0% |
| Foard | 3.0-8.0 | 100% | 21.0 | 0.0% |
| Bandys | 3.0-8.0 | 100% | 22.0 | 0.0% |
| Bunn | 5.0-6.0 | 100% | 18.0 | 0.0% |
| Central Davidson | 4.0-7.0 | 100% | 19.0 | 0.0% |
| Eastern Wayne | 5.0-5.0 | 100% | 20.0 | 0.0% |
| Lexington | 3.0-8.0 | 100% | 21.0 | 0.0% |
| Forbush | 4.0-7.0 | 100% | 23.0 | 0.0% |
| Jordan-Matthews | 4.0-7.0 | 100% | 22.0 | 0.0% |
| Lincoln Charter | 2.0-9.0 | 100% | 24.0 | 0.0% |
| Cummings | 1.0-10.0 | 100% | 23.0 | 0.0% |
| Carver | 3.0-8.0 | 100% | 24.0 | 0.0% |
| Ashe County | 1.0-9.0 | 0% | — | 0.0% |
| East Henderson | 1.0-9.0 | 0% | — | 0.0% |
| North Johnston | 2.0-8.0 | 0% | — | 0.0% |
| Brevard | 1.0-9.0 | 0% | — | 0.0% |
| Red Springs | 2.0-8.0 | 0% | — | 0.0% |
| Carrboro | 1.0-9.0 | 0% | — | 0.0% |
| North Lenoir | 0.0-10.0 | 0% | — | 0.0% |
3A
Projected champion: Shelby · wins the title in 33% of simulated seasons
RPI bubble
| School | Record | Playoff chance | Status | RPI today | Rank today | Projected RPI | |
|---|---|---|---|---|---|---|---|
| Edge of the bubble: last teams safely in | |||||||
| 46 | Patton | 1-9-0 | 100% | In | 0.32667 | 46 | 0.3327 |
| 47 | Bessemer City | 1-9-0 | 100% | In | 0.32533 | 48 | 0.3310 |
| 48 | Trinity | 1-9-0 | 100% | In | 0.30719 | 50 | 0.3078 |
| Projected cut · top 48 make the field | |||||||
| Edge of the bubble: first teams out | |||||||
| 49 | Goldsboro | 0-10-0 | 0% | Out | 0.29021 | 52 | 0.2956 |
| 50 | Bartlett Yancey | 1-9-0 | 0% | Out | 0.29315 | 51 | 0.2892 |
| 51 | Beddingfield | 0-10-0 | 0% | Out | 0.26539 | 53 | 0.2661 |
48 of 52 3A teams make the field. Teams are listed by their chance of finishing in it, from the season simulation, which plays out the games each team has left; the dashed line is where the field is projected to be cut, and the bracket is drawn from the teams above it. RPI today and Rank today are the official NCHSAA table as it stands: the top 48 would make it if the season ended now. Projected RPI is the average final RPI across the simulated seasons. The order goes by playoff chance, which also counts how far a team's finish could swing either way, so two teams close in projected RPI can sit a place or two apart.
Bracket, with projections
48 teams, 32-team bracket per region, the NCHSAA's field and seeds. 16 games played, marked Final; every other game goes to the team our model favors, with the score it predicts.


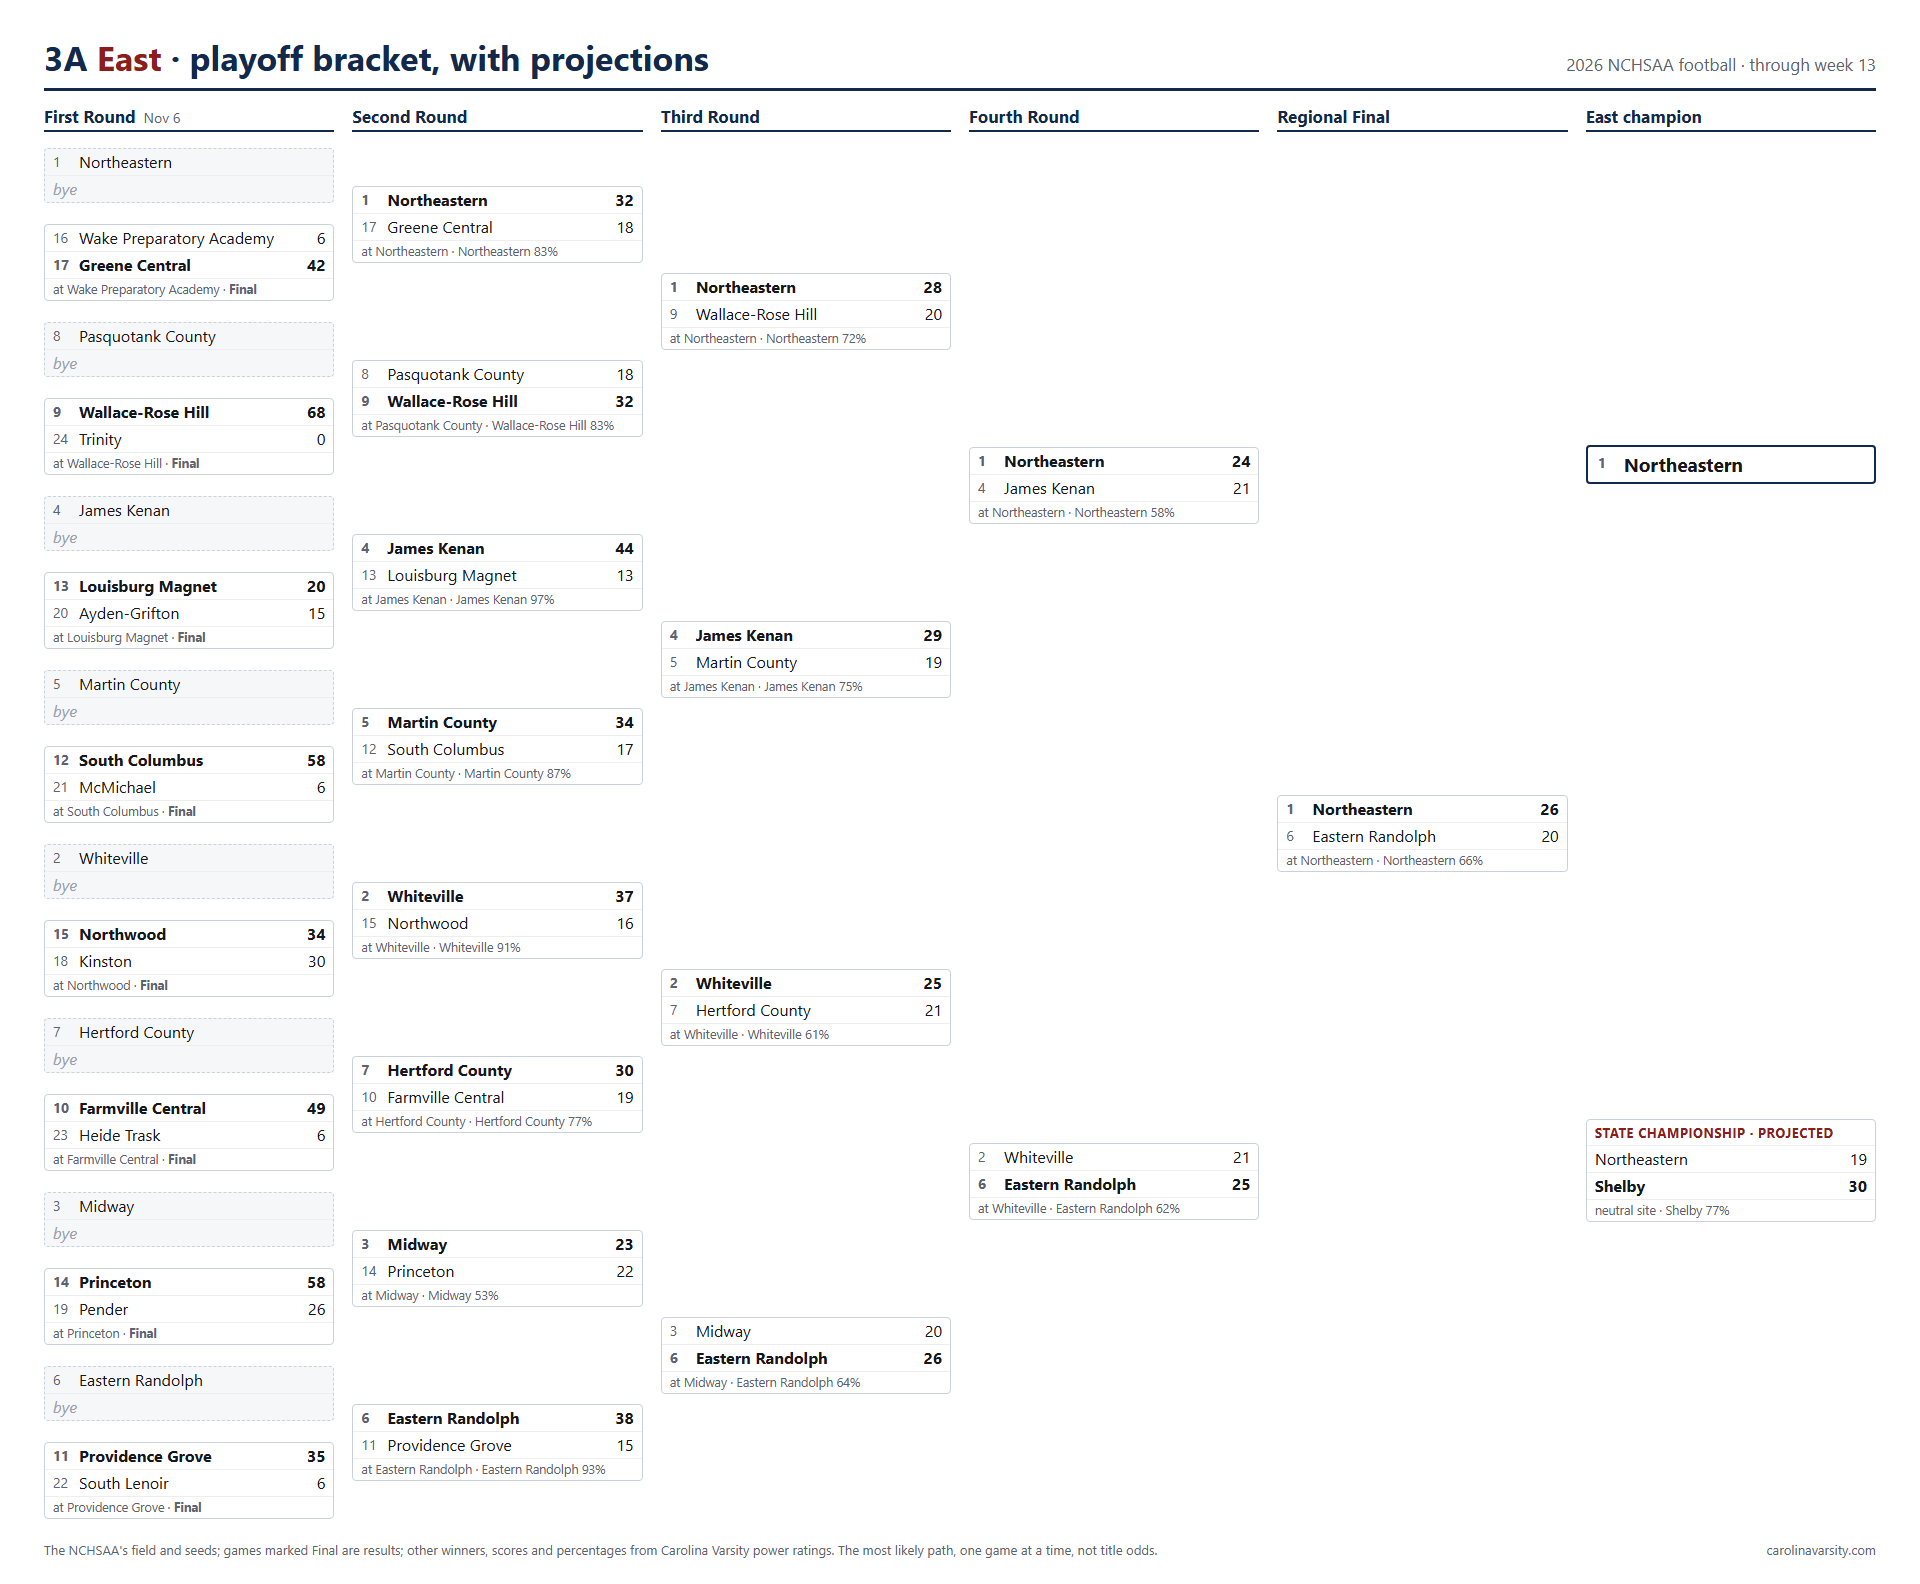
East
First Round
Byes: seeds 1-8
Second Round
Third Round
Fourth Round
Regional Final
West
First Round
Byes: seeds 1-8
Second Round
Third Round
Fourth Round
Regional Final
State Championship
Every 3A team's projection — 52 teams
| School | Proj. record | Playoffs | Avg seed | Title |
|---|---|---|---|---|
| Northeastern | 9.0-1.0 | 100% | 1.0 | 12.5% |
| North Stanly | 10.0-0.0 | 100% | 1.0 | 19.2% |
| Whiteville | 9.0-0.0 | 100% | 2.0 | 1.7% |
| Shelby | 9.0-1.0 | 100% | 2.0 | 33.3% |
| Midway | 8.0-1.0 | 100% | 3.0 | 2.5% |
| Hendersonville | 10.0-0.0 | 100% | 3.0 | 0.0% |
| James Kenan | 8.0-1.0 | 100% | 4.0 | 8.3% |
| Walkertown | 9.0-1.0 | 100% | 4.0 | 0.0% |
| Martin County | 7.0-3.0 | 100% | 5.0 | 0.8% |
| Eastern Randolph | 7.0-3.0 | 100% | 6.0 | 9.2% |
| Thomasville | 9.0-1.0 | 100% | 5.0 | 3.3% |
| Mount Airy | 7.0-3.0 | 100% | 6.0 | 0.8% |
| Chase | 8.0-2.0 | 100% | 7.0 | 0.0% |
| Lincolnton | 7.0-3.0 | 100% | 8.0 | 6.7% |
| Hertford County | 6.0-4.0 | 100% | 7.0 | 0.0% |
| Mountain Heritage | 8.0-3.0 | 100% | 9.0 | 0.0% |
| West Wilkes | 8.0-3.0 | 100% | 10.0 | 0.0% |
| Union Academy | 8.0-3.0 | 100% | 11.0 | 0.0% |
| Pasquotank County | 6.0-4.0 | 100% | 8.0 | 0.0% |
| Wallace-Rose Hill | 6.0-4.0 | 100% | 9.0 | 0.0% |
| West Davidson | 8.0-3.0 | 100% | 12.0 | 0.0% |
| Farmville Central | 7.0-4.0 | 100% | 10.0 | 0.0% |
| Providence Grove | 7.0-4.0 | 100% | 11.0 | 0.0% |
| South Columbus | 7.0-4.0 | 100% | 12.0 | 0.0% |
| Princeton | 6.0-5.0 | 100% | 13.0 | 1.7% |
| Northwood | 6.0-5.0 | 100% | 14.0 | 0.0% |
| Greene Central | 7.0-4.0 | 100% | 15.0 | 0.0% |
| Louisburg Magnet | 8.0-3.0 | 100% | 16.0 | 0.0% |
| Wake Preparatory Academy | 6.0-5.0 | 100% | 17.0 | 0.0% |
| East Surry | 5.0-6.0 | 100% | 13.0 | 0.0% |
| North Wilkes | 5.0-6.0 | 100% | 14.0 | 0.0% |
| Owen | 5.0-6.0 | 100% | 15.0 | 0.0% |
| East Rutherford | 3.0-8.0 | 100% | 16.0 | 0.0% |
| Kinston | 5.0-6.0 | 100% | 18.0 | 0.0% |
| West Lincoln | 4.0-7.0 | 100% | 17.0 | 0.0% |
| Polk County | 4.0-7.0 | 100% | 18.0 | 0.0% |
| Pender | 4.0-7.0 | 100% | 19.0 | 0.0% |
| Pine Lake Preparatory | 4.0-7.0 | 100% | 19.0 | 0.0% |
| East Davidson | 3.0-8.0 | 100% | 20.0 | 0.0% |
| Wheatmore | 3.0-8.0 | 100% | 21.0 | 0.0% |
| Ayden-Grifton | 2.0-9.0 | 100% | 20.0 | 0.0% |
| McMichael | 2.0-9.0 | 100% | 21.0 | 0.0% |
| South Lenoir | 3.0-8.0 | 100% | 22.0 | 0.0% |
| Heide Trask | 2.0-9.0 | 100% | 23.0 | 0.0% |
| Draughn | 0.0-11.0 | 100% | 22.0 | 0.0% |
| Patton | 1.0-10.0 | 100% | 23.0 | 0.0% |
| Bessemer City | 1.0-10.0 | 100% | 24.0 | 0.0% |
| Trinity | 1.0-10.0 | 100% | 24.0 | 0.0% |
| Goldsboro | 0.0-10.0 | 0% | — | 0.0% |
| Bartlett Yancey | 1.0-9.0 | 0% | — | 0.0% |
| Beddingfield | 0.0-10.0 | 0% | — | 0.0% |
| Surry Central | 0.0-10.0 | 0% | — | 0.0% |
2A
Projected champion: Tarboro · wins the title in 36% of simulated seasons
RPI bubble
All 44 2A teams make the 48-team field, so there is no bubble in 2A.
Bracket, with projections
44 teams, 32-team bracket per region, the NCHSAA's field and seeds. 12 games played, marked Final; every other game goes to the team our model favors, with the score it predicts.


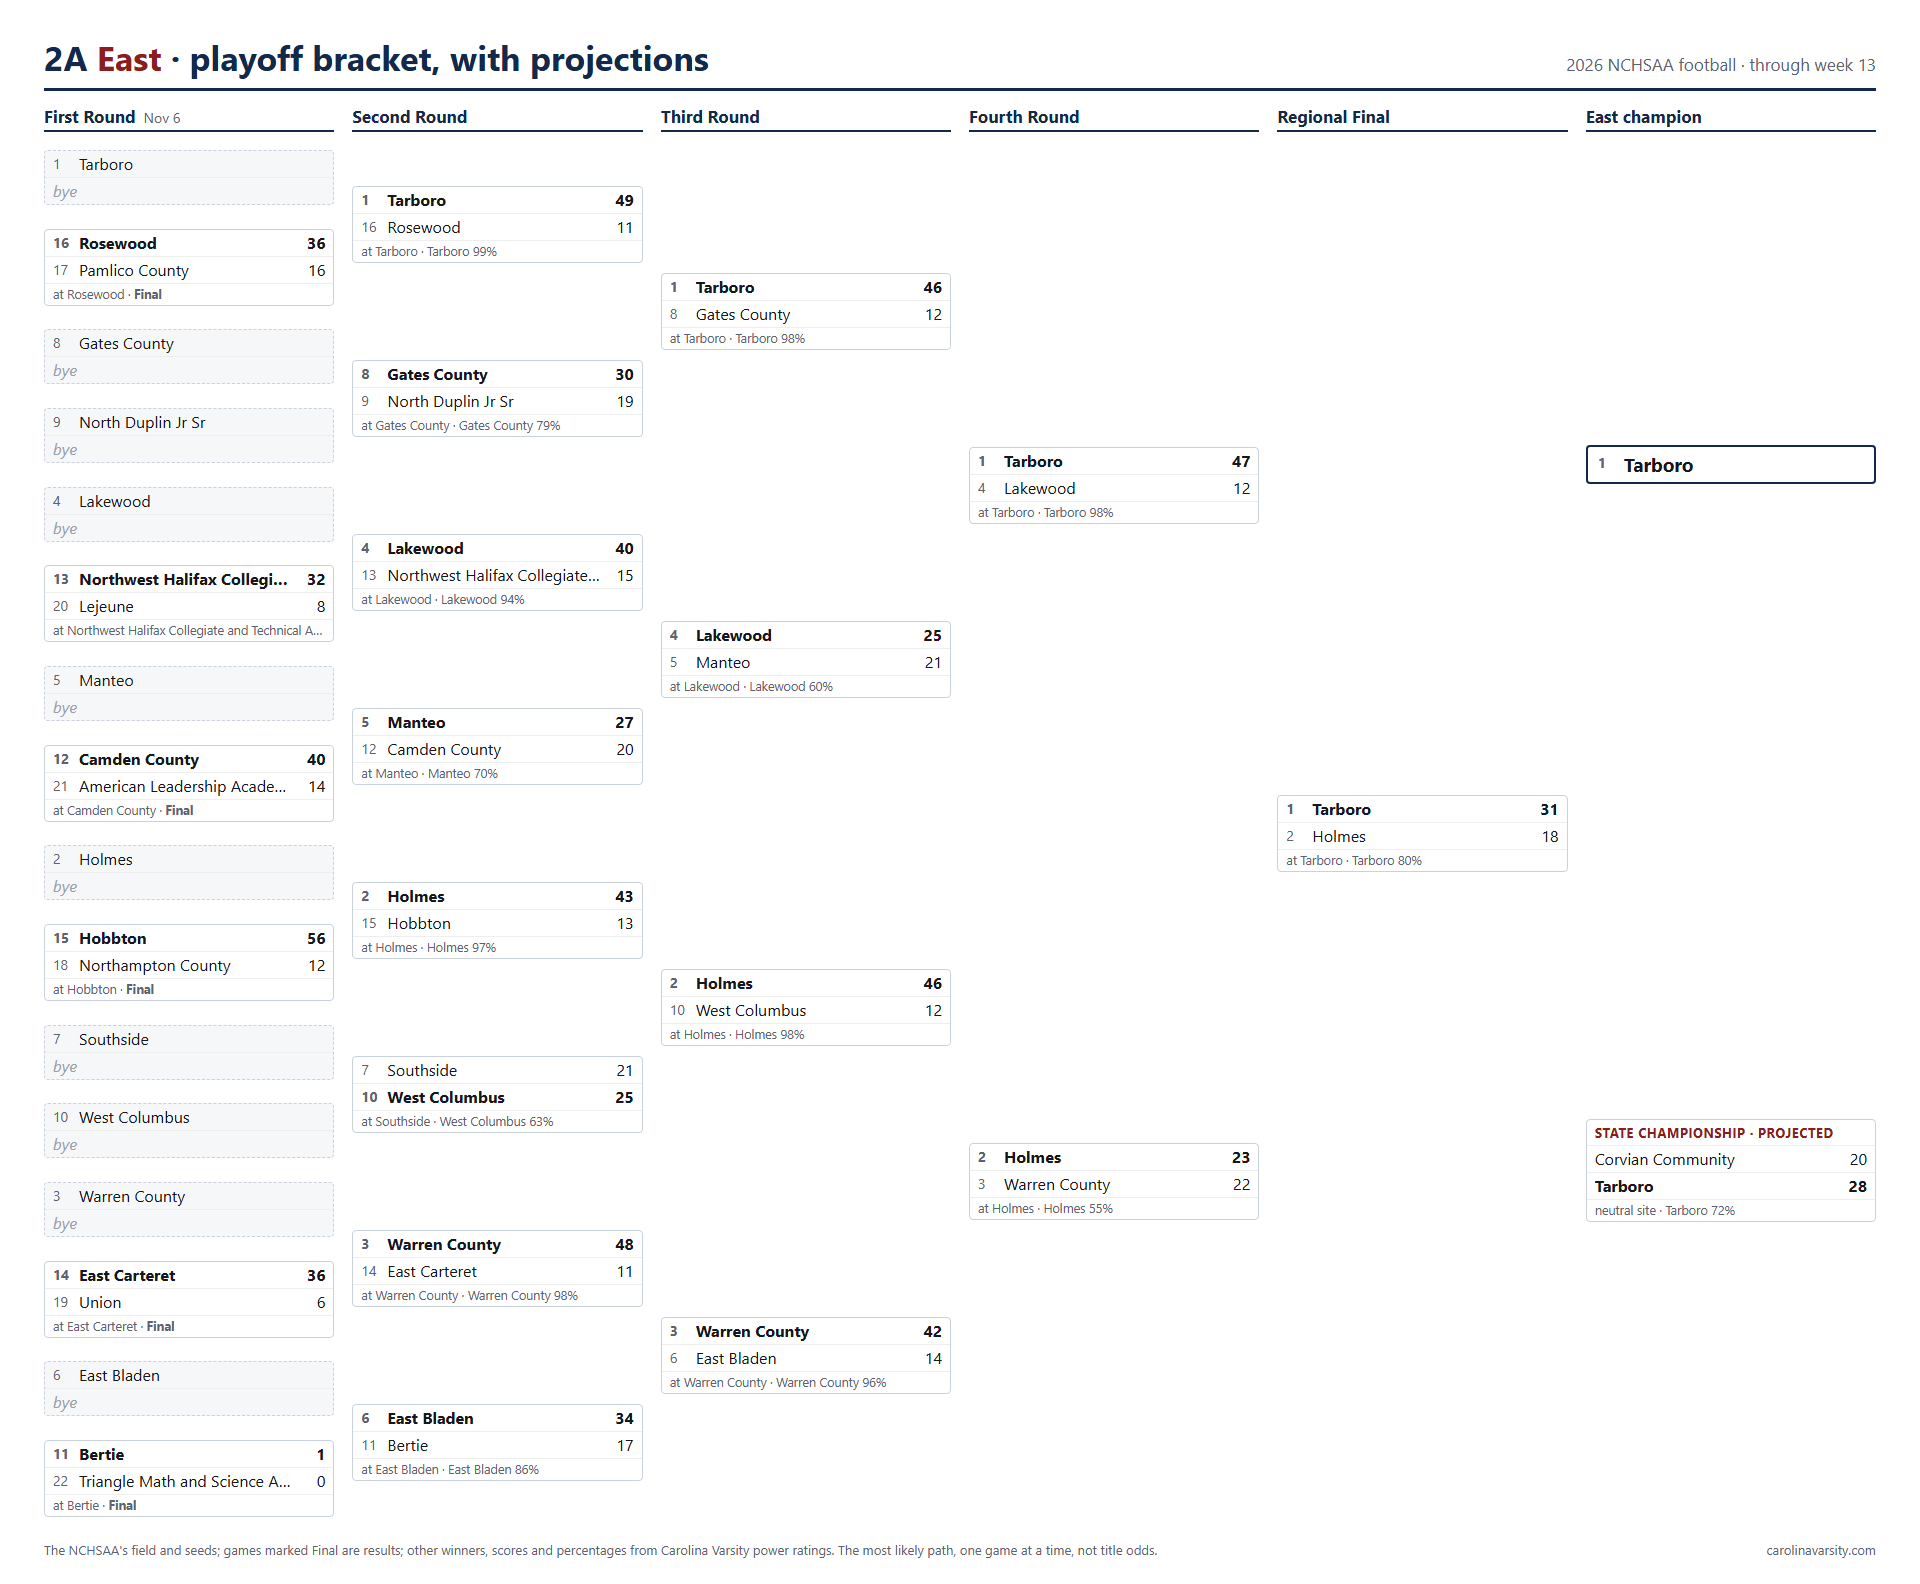
East
First Round
Byes: seeds 1-10
Second Round
Third Round
Fourth Round
Regional Final
West
First Round
Byes: seeds 1-10
Second Round
Third Round
Fourth Round
Regional Final
State Championship
Every 2A team's projection — 44 teams
| School | Proj. record | Playoffs | Avg seed | Title |
|---|---|---|---|---|
| Corvian Community | 9.0-1.0 | 100% | 1.0 | 18.3% |
| Starmount | 9.0-1.0 | 100% | 2.0 | 9.2% |
| Holmes | 8.0-1.0 | 100% | 1.0 | 25.8% |
| Tarboro | 9.0-1.0 | 100% | 2.0 | 35.8% |
| Warren County | 10.0-0.0 | 100% | 3.0 | 5.8% |
| Murphy | 8.0-2.0 | 100% | 3.0 | 0.0% |
| Alleghany | 7.0-3.0 | 100% | 4.2 | 0.8% |
| Community School of Davidson | 7.0-3.0 | 100% | 4.8 | 0.8% |
| North Rowan | 7.0-3.0 | 100% | 6.0 | 2.5% |
| Lakewood | 7.0-3.0 | 100% | 4.0 | 0.0% |
| Manteo | 7.0-3.0 | 100% | 5.0 | 0.0% |
| Mountain Island Charter | 8.0-2.0 | 100% | 7.0 | 0.0% |
| East Bladen | 7.0-3.0 | 100% | 6.0 | 0.0% |
| East Wilkes | 6.0-4.0 | 100% | 8.0 | 0.8% |
| Christ the King | 7.0-3.0 | 100% | 9.0 | 0.0% |
| Southside | 7.0-3.0 | 100% | 7.0 | 0.0% |
| Mitchell | 7.0-3.0 | 100% | 10.0 | 0.0% |
| Cherokee | 7.0-4.0 | 100% | 11.0 | 0.0% |
| Cherryville | 7.0-4.0 | 100% | 12.0 | 0.0% |
| Gates County | 5.0-5.0 | 100% | 8.0 | 0.0% |
| North Duplin Jr Sr | 5.0-4.0 | 100% | 9.0 | 0.0% |
| West Columbus | 5.0-5.0 | 100% | 10.0 | 0.0% |
| Albemarle | 5.0-6.0 | 100% | 13.0 | 0.0% |
| Bertie | 4.0-7.0 | 100% | 11.0 | 0.0% |
| Camden County | 5.0-6.0 | 100% | 12.0 | 0.0% |
| Northwest Halifax Collegiate and Technical Academy | 6.0-5.0 | 100% | 13.0 | 0.0% |
| East Carteret | 5.0-6.0 | 100% | 14.0 | 0.0% |
| Hobbton | 4.0-7.0 | 100% | 15.0 | 0.0% |
| Rosewood | 4.0-7.0 | 100% | 16.0 | 0.0% |
| South Stokes | 5.0-6.0 | 100% | 14.0 | 0.0% |
| Swain County | 3.0-8.0 | 100% | 15.0 | 0.0% |
| Langtree Charter Academy | 4.0-7.0 | 100% | 16.0 | 0.0% |
| South Stanly | 3.0-8.0 | 100% | 17.0 | 0.0% |
| Pamlico County | 3.0-8.0 | 100% | 17.0 | 0.0% |
| Avery County | 3.0-8.0 | 100% | 18.0 | 0.0% |
| Bishop McGuinness | 3.0-8.0 | 100% | 19.0 | 0.0% |
| Elkin | 2.0-9.0 | 100% | 20.0 | 0.0% |
| Union | 3.0-8.0 | 100% | 18.0 | 0.0% |
| Bradford Preparatory | 2.0-9.0 | 100% | 21.0 | 0.0% |
| Northampton County | 2.0-10.0 | 100% | 19.0 | 0.0% |
| Lejeune | 2.0-8.0 | 100% | 20.0 | 0.0% |
| Hayesville | 1.0-9.0 | 100% | 22.0 | 0.0% |
| American Leadership Academy - Johnston | 1.0-9.0 | 100% | 21.0 | 0.0% |
| Triangle Math and Science Academy | 1.0-7.0 | 100% | 22.0 | 0.0% |
1A
Projected champion: Northside · wins the title in 60% of simulated seasons
RPI bubble
All 22 1A teams make the 48-team field, so there is no bubble in 1A.
Bracket, with projections
22 teams, 16-team bracket per region, the NCHSAA's field and seeds. 5 games played, marked Final; every other game goes to the team our model favors, with the score it predicts.


East
First Round
Byes: seeds 1-5
Second Round
Third Round
Regional Final
West
First Round
Byes: seeds 1-5
Second Round
Third Round
Regional Final
State Championship
Every 1A team's projection — 22 teams
| School | Proj. record | Playoffs | Avg seed | Title |
|---|---|---|---|---|
| Northside | 10.0-0.0 | 100% | 1.0 | 60.0% |
| Chatham Central | 10.0-0.0 | 100% | 1.0 | 0.8% |
| Wilson Preparatory Academy | 6.0-4.0 | 100% | 2.0 | 30.8% |
| Hobgood Charter | 7.0-2.0 | 100% | 2.0 | 0.0% |
| Sallie B Howard | 6.0-3.0 | 100% | 3.0 | 0.0% |
| Robbinsville | 5.0-5.0 | 100% | 3.0 | 6.7% |
| North Edgecombe | 6.0-4.0 | 100% | 4.0 | 0.0% |
| Winston-Salem Preparatory Acad | 6.0-4.0 | 100% | 4.0 | 0.8% |
| East Columbus Junior-Senior | 4.0-6.0 | 100% | 5.0 | 0.0% |
| Rosman | 6.0-5.0 | 100% | 6.0 | 0.0% |
| Southeast Collegiate Prep Academy | 4.0-6.0 | 100% | 5.0 | 0.0% |
| South Davidson Middle and | 6.0-5.0 | 100% | 7.0 | 0.0% |
| KIPP Pride | 4.0-7.0 | 100% | 6.0 | 0.0% |
| College Prep and Leadership Academy | 3.0-7.0 | 100% | 8.0 | 0.0% |
| Rocky Mount Preparatory | 4.0-7.0 | 100% | 7.0 | 0.0% |
| Columbia | 2.0-5.0 | 100% | 8.0 | 0.0% |
| Washington County | 2.0-8.0 | 100% | 9.0 | 0.8% |
| Bonnie Cone Leadership Academy | 1.0-10.0 | 100% | 9.0 | 0.0% |
| Andrews | 1.0-9.0 | 100% | 10.0 | 0.0% |
| North Stokes | 1.0-10.0 | 100% | 11.0 | 0.0% |
| Weldon STEM | 1.0-9.0 | 100% | 10.0 | 0.0% |
| Jones | 0.0-11.0 | 100% | 11.0 | 0.0% |